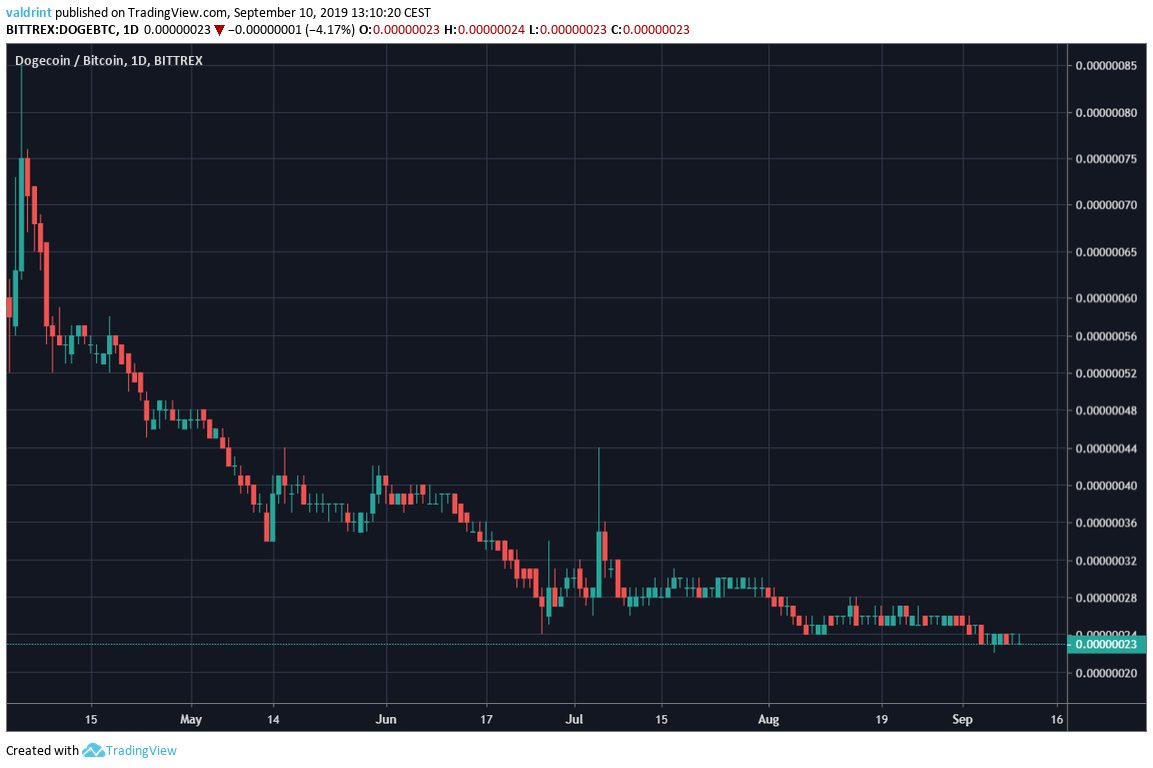
On April 4, 2019, the Dogecoin price reached a high of 85 satoshis. A rapid decrease followed. The price has been on a downtrend since. However, the rate of decrease has slowed down considerably since late June.
At the time of writing, DOGE was trading at 23 satoshis.
Will the downtrend continue for DOGE or is there a reversal in store? Continue reading if you are interested in finding out.
Dogecoin Price: Trends and Highlights for September 10
Long-Term Support
Looking at the weekly time-frame we can see that DOGE is trading at its lowest levels since December 2017.
We can also see two support areas:
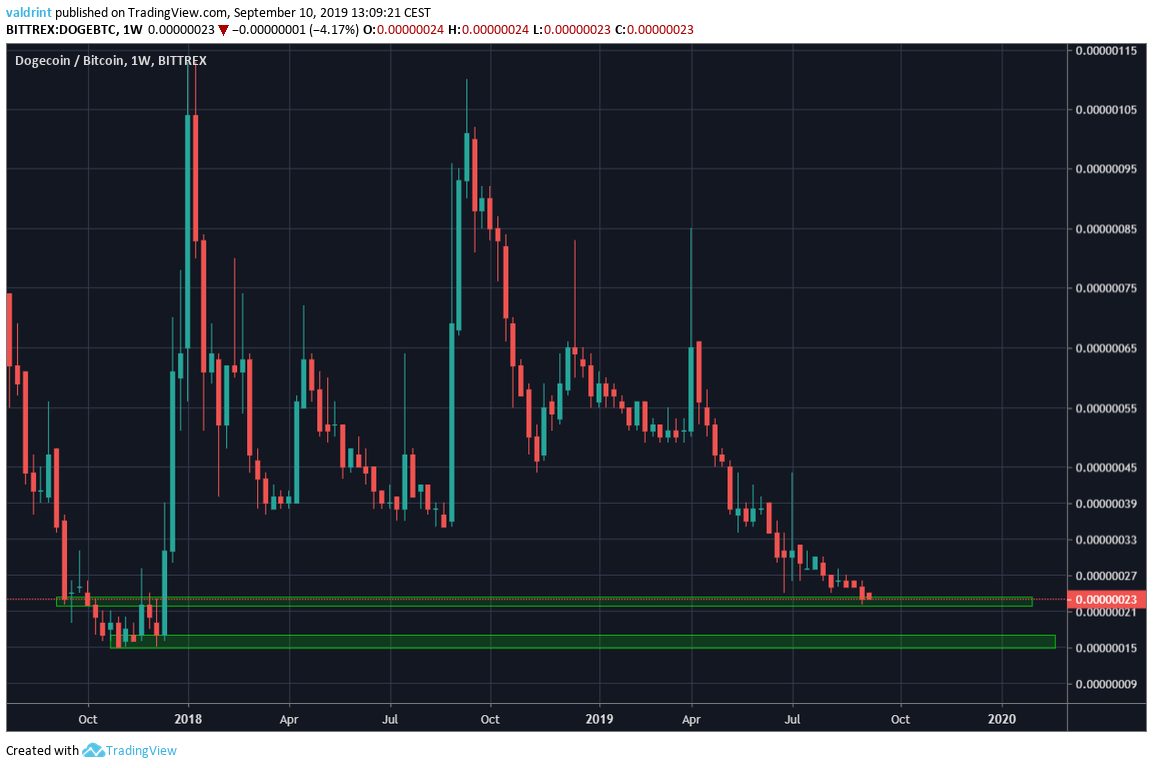
At the time of writing, the price was trading inside the first area.
Will it be successful in initiating a reversal?
Will History Repeat?
The first sign that DOGE might begin a reversal is found when looking at the weekly MACD.
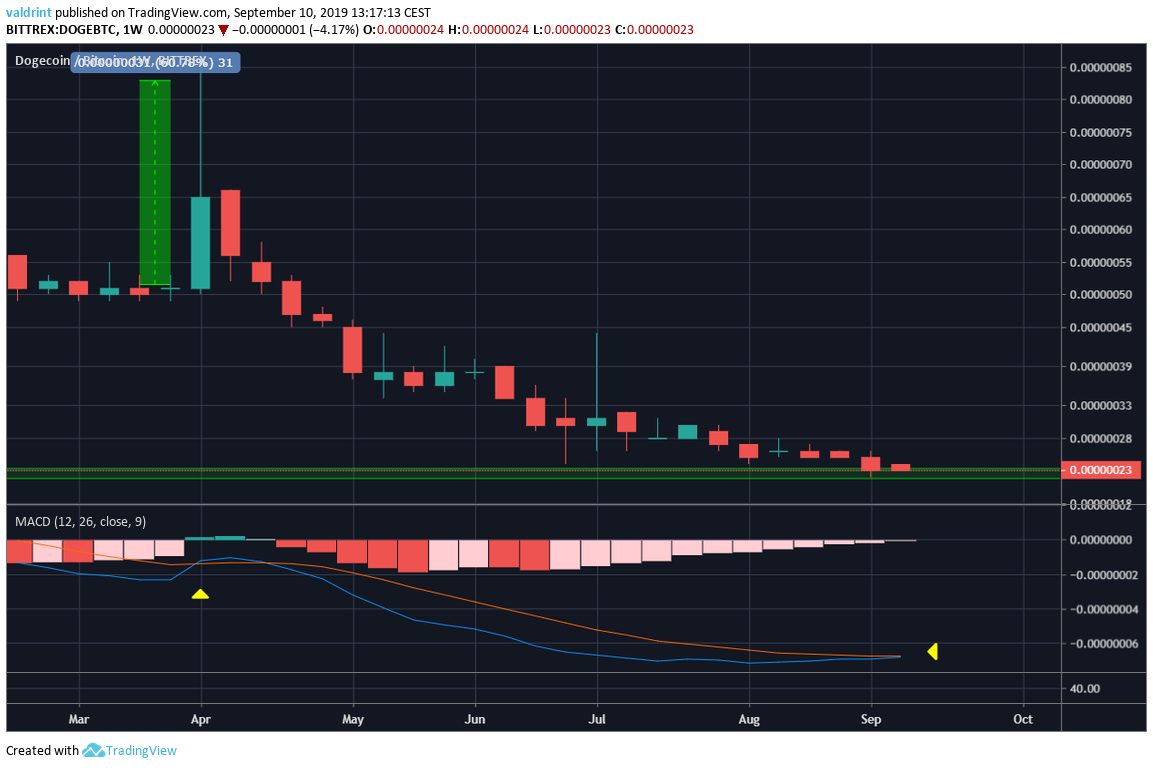
At the time of writing, it was very close to generating a bullish cross.
The previous time this occurred, on April 2019, DOGE initiated a rapid upward move, increasing by roughly 60% in one week.
However, while the RSI is deep into oversold territory, it has not yet began to generate any divergence.
Dogecoin Price Descending Resistance
A look at the daily time-frame shows that DOGE has been following a descending resistance line since May 30.
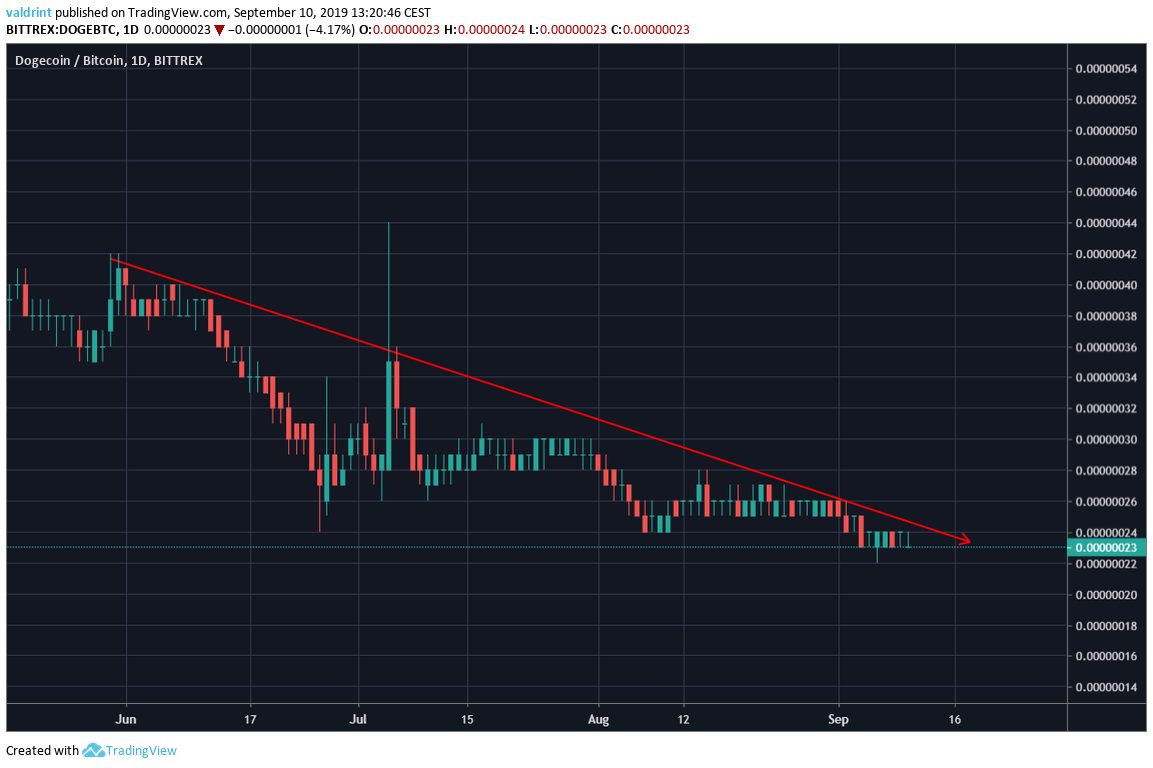
At the time of writing, it was trading very close to the line.
Additionally, both the RSI and the MACD have been generating bullish divergence.
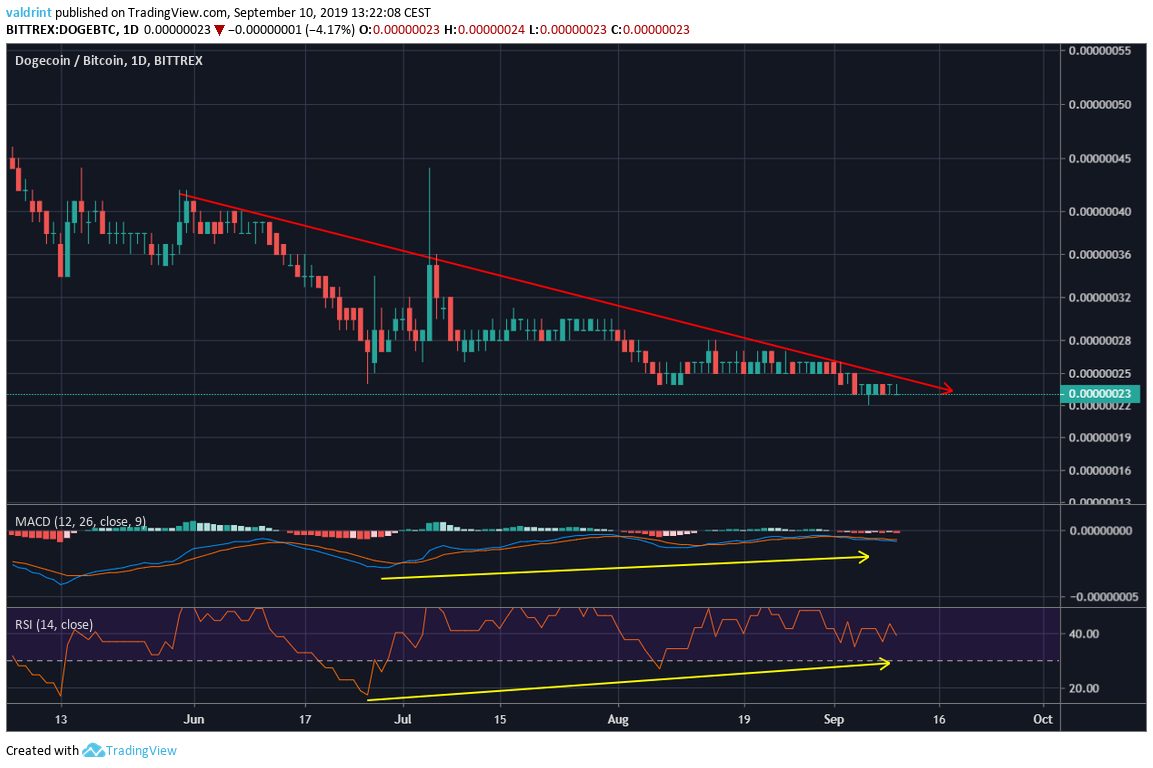
However, it is worth mentioning that the divergence has been in place for a very long period of time, and as of yet has been unsuccessful in initiating upward moves.
Future Movement
An outline of possible future price movement is given below.
Additionally, one resistance area is outlined.
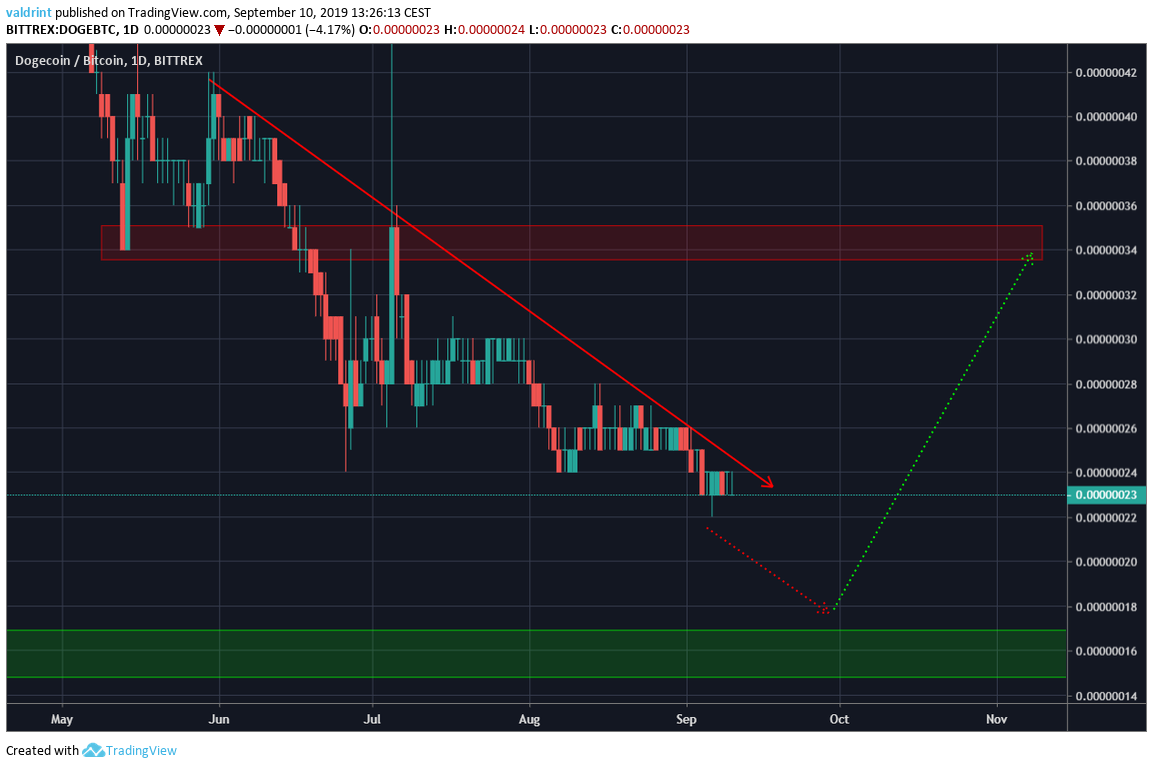
The price could continue the decrease at the rate predicted by the line until it reaches the major support area.
Afterwards, it is likely to break out and reach the resistance area at 34 satoshis.
While it is possible that DOGE breaks out before reaching the support area, due to the current lack of interest in the market we think that is unlikely.
Dogecoin Price Summary
The DOGE price is trading inside a minor support area.
Additionally, it is following a descending resistance line.
According to our analysis, the price is likely to eventually break out above the descending resistance line.
However, it could first decrease towards the major support area.
For trading purposes, DOGE can be considered a buy only for long-term time-frames.
The potential for short-term losses make it a less enticing buy option for shorter-term trades.
