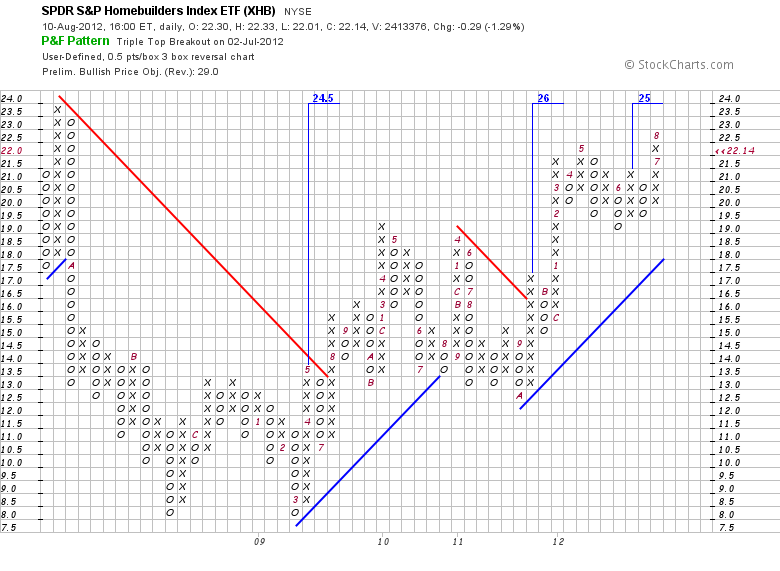
While the market participants attention is mainly focused on the major indices, the Homebuilders ETF (XHB) is quietly making a new yearly high. Actually, XHB didn't hover so high since 2008. An obvious question is how far can XHB climb from here in the coming months. Let's take a look at the long-term P&F chart of XHB with 0.5 pts/box.
We see that three well defined lows were formed in 2009, 2011 and 2012. Vertical counts calculated from these lows point to 24.5, 26 and 25 respectively. Three counts calculated from three different locations give us a cluster of price targets in the 24.5 – 26 area.
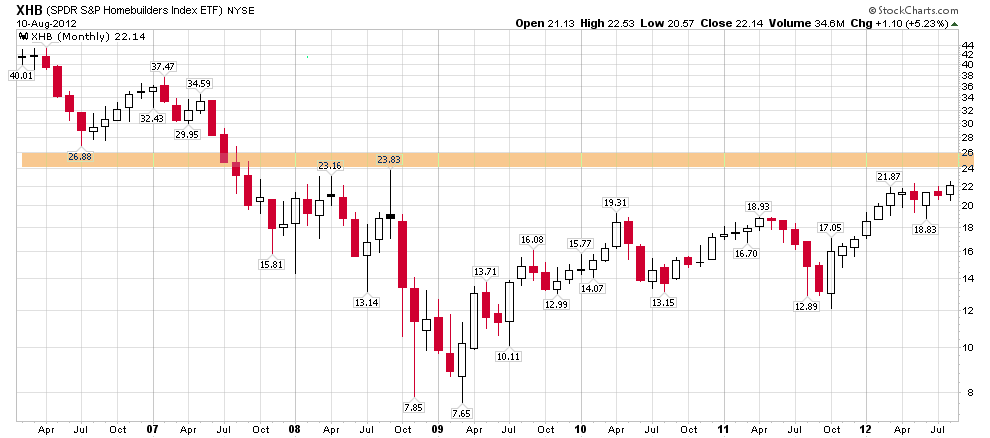
I marked this area with a tan rectangle on the XHB monthly chart. By coincidence or not, this rectangle overlays the former support level from summer 2007 which turned into resistance later in 2008. So, this area is a reasonable price target where some consolidation/retracement is highly possible.
Disclaimer: I express only my personal opinion on the market and do not provide any trading or financial advice (see Disclaimer on my site).
- English (UK)
- English (India)
- English (Canada)
- English (Australia)
- English (South Africa)
- English (Philippines)
- English (Nigeria)
- Deutsch
- Español (España)
- Español (México)
- Français
- Italiano
- Nederlands
- Português (Portugal)
- Polski
- Português (Brasil)
- Русский
- Türkçe
- العربية
- Ελληνικά
- Svenska
- Suomi
- עברית
- 日本語
- 한국어
- 简体中文
- 繁體中文
- Bahasa Indonesia
- Bahasa Melayu
- ไทย
- Tiếng Việt
- हिंदी
How High Will The Homebuilders ETF (XHB) Go?
Published 08/11/2012, 11:50 PM
Updated 07/09/2023, 06:31 AM
How High Will The Homebuilders ETF (XHB) Go?
Latest comments
Loading next article…
Install Our App
Risk Disclosure: Trading in financial instruments and/or cryptocurrencies involves high risks including the risk of losing some, or all, of your investment amount, and may not be suitable for all investors. Prices of cryptocurrencies are extremely volatile and may be affected by external factors such as financial, regulatory or political events. Trading on margin increases the financial risks.
Before deciding to trade in financial instrument or cryptocurrencies you should be fully informed of the risks and costs associated with trading the financial markets, carefully consider your investment objectives, level of experience, and risk appetite, and seek professional advice where needed.
Fusion Media would like to remind you that the data contained in this website is not necessarily real-time nor accurate. The data and prices on the website are not necessarily provided by any market or exchange, but may be provided by market makers, and so prices may not be accurate and may differ from the actual price at any given market, meaning prices are indicative and not appropriate for trading purposes. Fusion Media and any provider of the data contained in this website will not accept liability for any loss or damage as a result of your trading, or your reliance on the information contained within this website.
It is prohibited to use, store, reproduce, display, modify, transmit or distribute the data contained in this website without the explicit prior written permission of Fusion Media and/or the data provider. All intellectual property rights are reserved by the providers and/or the exchange providing the data contained in this website.
Fusion Media may be compensated by the advertisers that appear on the website, based on your interaction with the advertisements or advertisers.
© 2007-2025 - Fusion Media Limited. All Rights Reserved.
