Many of us in the financial services industry expected the outcome of the election to be determined by Ohio alone. Perhaps surprisingly, while Ohio was close throughout the evening, there was never a need for recounting the “Buckeye State” ballots; President Obama had won the electoral votes needed without a single-state showdown.
While a protracted battle for control of the White House could have unhinged market participants, the possibility quickly gave way to the more pressing “fiscal cliff.” The cessation of scores of tax breaks combined with automatic spending cuts can be credited with enormous selling pressure across the risk spectrum on 11/7/2012.
Unlike election uncertainty, however, market-watchers have been warning about the ramifications of a prolonged fiscal debate for months. In my 10/17 commentary, I identified 3 broad ETF categories that are less troubled by the partisan divide on on tax extensions and budgetary belt-tightening.
As of yesterday though, investors have been running for the hills. Other than risk-off bond choices, there’s very little in the positive column.
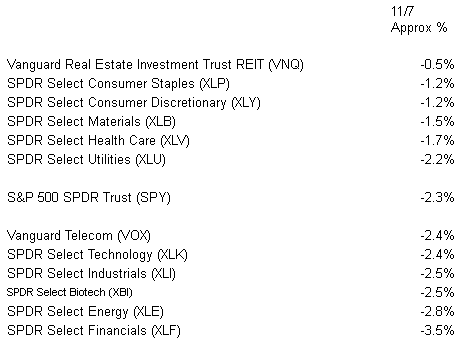
That said, it may be instructive to view how the different economic segments are faring. Indeed, not every stock ETF is down as much as the broader S&P 500 SPDR Trust (SPY).
Economic Sector ETFs Respond Differently To Fiscal Cliff Concerns 
As one might anticipate, most of the economically sensitive sectors have been getting hit the hardest. Energy (XLE), Industrials (XLI), Financials (XLF) and Technology (XLK) have taken the brunt of the risk-off activity.
There are several areas that may represent pockets of opportunity. For example, few areas of the market have been ravaged more by weak domestic and weak global demand than Materials (XLB). Why, then, should this sector behave a bit like a non-cyclical segment?
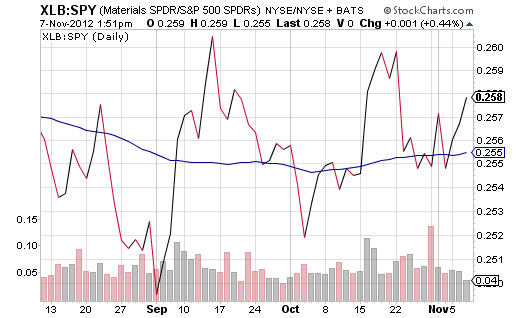
There are two possibilities. First, more and more folks believe in the probability of a resilient China. The more Chinese demand for “stuff,” the better XLB performs. Indeed, the series of “higher lows” in September, October and November for the XLB:SPY price ratio is a sign of relative strength in the materials arena.
There’s another possibility, albeit a stealth one at that. President Obama’s victory assures a continuation of the ultra-easy monetary policy of the Federal Reserve. (Note: Romney had talked about his opposition to Bernanke’s electronic money printing.) It follows that there are a number of gold/metals miners in the S&P Basic Materials Index like Newmont Mining (NEM); some of them were essentially flat on the trading session, as gold figures to benefit from Obama’s second term.
Last, but not least, Consumer Discretionary (XLY) showed signs of relative strength in the dramatic sell-off as well. It may speak to the electorate’s increasing consumption and increasing sentiment. It may also be ignoring revenue misses and poor earnings guidance going forward, but that’s for another discussion.
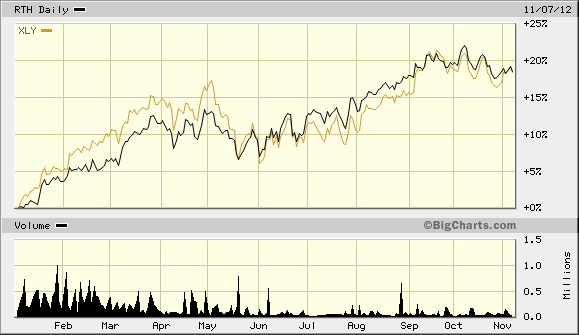
Market Vectors Retail (RTH) may offer a less volatile way to invest in the consumer. It is weighted equally between consumer defensive and cyclical consumer stationary and has a lower beta than XLY. And yet, RTH has outperformed XLY year-to-date. 
Disclosure: Gary Gordon, MS, CFP is the president of Pacific Park Financial, Inc., a Registered Investment Adviser with the SEC. Gary Gordon, Pacific Park Financial, Inc, and/or its clients may hold positions in the ETFs, mutual funds, and/or any investment asset mentioned above. The commentary does not constitute individualized investment advice. The opinions offered herein are not personalized recommendations to buy, sell or hold securities. At times, issuers of exchange-traded products compensate Pacific Park Financial, Inc. or its subsidiaries for advertising at the ETF Expert web site. ETF Expert content is created independently of any advertising relationships.
- English (UK)
- English (India)
- English (Canada)
- English (Australia)
- English (South Africa)
- English (Philippines)
- English (Nigeria)
- Deutsch
- Español (España)
- Español (México)
- Français
- Italiano
- Nederlands
- Português (Portugal)
- Polski
- Português (Brasil)
- Русский
- Türkçe
- العربية
- Ελληνικά
- Svenska
- Suomi
- עברית
- 日本語
- 한국어
- 简体中文
- 繁體中文
- Bahasa Indonesia
- Bahasa Melayu
- ไทย
- Tiếng Việt
- हिंदी
How Different Sector ETFs Are Reacting To Fiscal Cliff Fears
Published 11/08/2012, 05:04 AM
Updated 07/09/2023, 06:31 AM
How Different Sector ETFs Are Reacting To Fiscal Cliff Fears
Latest comments
Loading next article…
Install Our App
Risk Disclosure: Trading in financial instruments and/or cryptocurrencies involves high risks including the risk of losing some, or all, of your investment amount, and may not be suitable for all investors. Prices of cryptocurrencies are extremely volatile and may be affected by external factors such as financial, regulatory or political events. Trading on margin increases the financial risks.
Before deciding to trade in financial instrument or cryptocurrencies you should be fully informed of the risks and costs associated with trading the financial markets, carefully consider your investment objectives, level of experience, and risk appetite, and seek professional advice where needed.
Fusion Media would like to remind you that the data contained in this website is not necessarily real-time nor accurate. The data and prices on the website are not necessarily provided by any market or exchange, but may be provided by market makers, and so prices may not be accurate and may differ from the actual price at any given market, meaning prices are indicative and not appropriate for trading purposes. Fusion Media and any provider of the data contained in this website will not accept liability for any loss or damage as a result of your trading, or your reliance on the information contained within this website.
It is prohibited to use, store, reproduce, display, modify, transmit or distribute the data contained in this website without the explicit prior written permission of Fusion Media and/or the data provider. All intellectual property rights are reserved by the providers and/or the exchange providing the data contained in this website.
Fusion Media may be compensated by the advertisers that appear on the website, based on your interaction with the advertisements or advertisers.
© 2007-2025 - Fusion Media Limited. All Rights Reserved.
