In early August I wrote about 3 major market themes that I expected would continue to emerge or completely reverse.

First was the focus on the junk bonds (NYSE:JNK) and investment grade bonds (NYSE:LQD).
Junk bonds have remained strong indicating the appetite for high risk companies has not waned-good, news for the market.
LQD or investment grade bonds sold off into a warning phase. However, on a weekly chart, it held just where it needed to at 134.54-the area of support for now.
Second was the focus on the banking and financial sectors of the market.
Although those sectors saw a brief pop, XLF (NYSE:XLF) and KRE (NYSE:KRE) are pretty much exactly at the prices they were when I left.
What does that mean?
Most likely, these areas reflect the reality of the economy and how many loan defaults and bankruptcies continue to plague real economic growth.
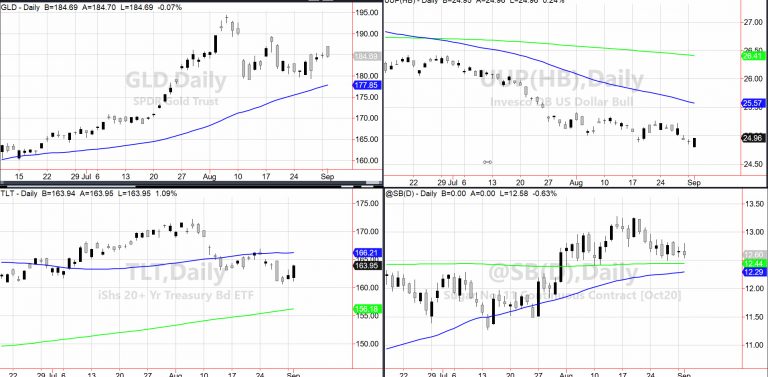
Third was the dollar, low rates, rising metals, up move in sugar and all the factors that still support a stagflation theory.
Is that still in play?
No doubt the recent rally to new highs in the S&P 500 (NYSE:SPY) and Nasdaq (NASDAQ:QQQ) is impressive.
However, this market remains divided, with stocks skyrocketing or languishing and not much in between.
The Economic Modern Family is equally mixed with the Russell 2000 (NYSE:IWM) and Russell 3000 (NYSE:IWV) trading sideways. Regional Banks (NYSE:KRE) stuck near the bottom of the range and Semiconductors (NYSE:SMH) are flying.
Here is where we see the stagnation part of the stagflation theory.
To date, grains (wheat and soybeans), which I have pointed out repeatedly as trading at 100-year lows versus the SPY, have rallied well.
Gold has held its gains although has yet to convincingly clear $2000 an ounce.
Rates have firmed a bit while the dollar continues to freefall. Only yesterday, the dollar found some footing, which could take it to test overhead resistance.
Sugar, my secret sauce for stagflation, edged higher. Above both the 50 and 200-DMAs, provided cash holds above 12.25, sugar can continue to tell us more about rising food costs amid supply chain disruptions.
I am still watching commodities, particularly gold and silver.
And now, with civil unrest a daily headline globally as well in the US, the market, which is very one-sided towards tech, could be close to overdone.
For that, volatility is a key to keep eyes on.
After a reversal bottoming pattern on August 26 confirmed, even while NASDAQ runs, a move in VIX (the fear index), over the 50-DMA (Recuperation Phase) where it hovers now, could mean trouble.
S&P 500 Low Volume Rally to new Highs (348 Support 345 Key)
Russell 2000 Sideways price action (153 Support 157 Resistance Key 160.
Dow Still has gap to fill at 288.75 (282 Key support.)
Nasdaq 300 psychological resistance (288 key support.)
KRE (Regional Banks) 38 key support 40 resistance.
SMH (Semiconductors) 173 key support
IYT (Transportation) Has ability to take lead if hold 197
IBB (Biotechnology) Trading range 130-137
XRT (Retail) 50.00 key support
Volatility Index (VXX) Index confirms recuperation phase ( On Radar)
Junk Bonds (JNK) 105 support
LQD (iShs iBoxx High yield Bonds) 134.55 key support
