Investing.com’s stocks of the week
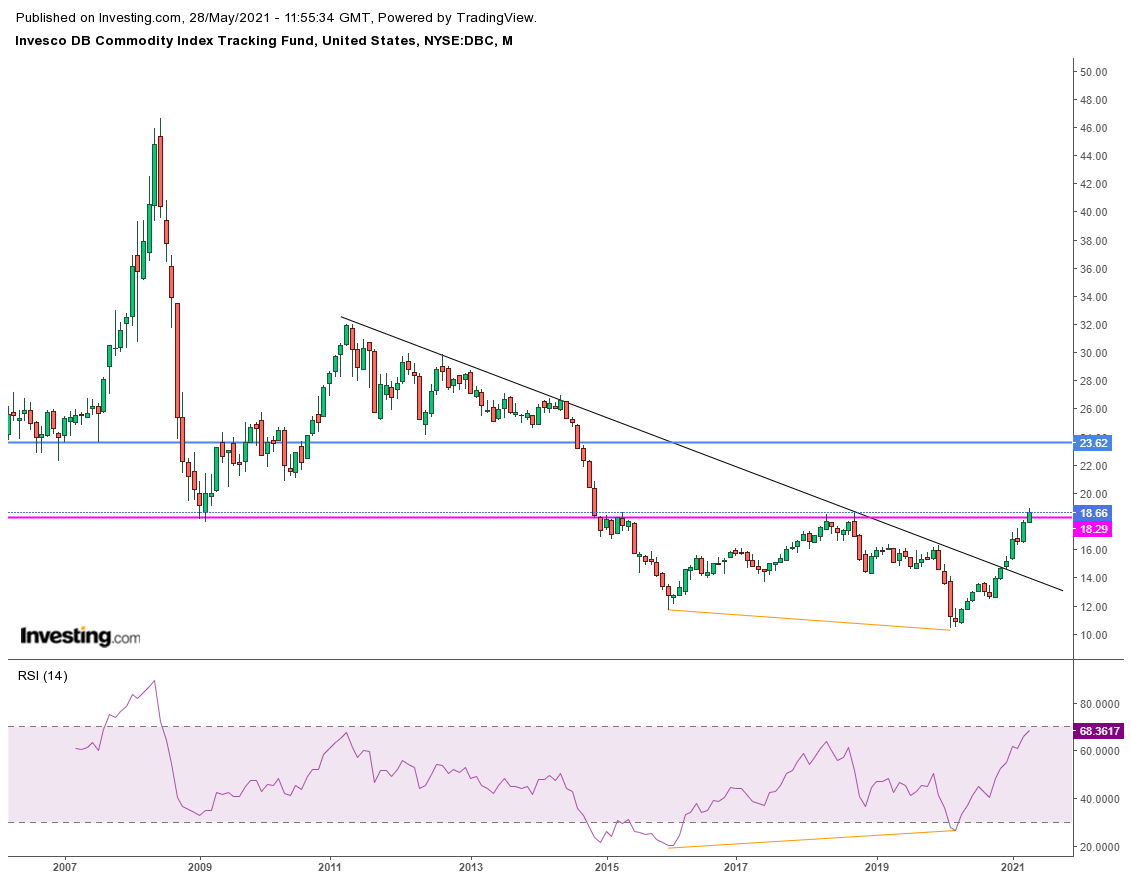
There are still some very basic things that we can look to for exposure in an inflationary setup. One of those is the Invesco DB Commodity Index Tracking Fund (NYSE:DBC). This is a fund that claims to track a basket of commodity prices. As an investment this fund has been pretty disappointing for a decade. But even fundamental setup aside, from technician's perspective, how can you not buy this chart? These are the kinds of setups traders look for.
It's long term monthly view, and we are just one day from officially printing another breakout in BTC. You can see back in January DBC broke above the downtrend line (black line). This month, it finally broke above what has been long term resistance for several years (pink line). Coupled with that, we have one of my favorite buy signals to look for, a bullish RSI divergence. I think this thing is going to $23.50. Probably later this year or early next year.
$23.50 on DBC means that commodity prices are ripping. That means consumer price inflation is probably also ripping. Will you believe the BLS's inflation number later this year if commodities are 30% higher? I won't. So I'll ask, how can you not buy this chart?
Disclaimer: I am not an investment professional. I merely share what I am doing so you can form your own opinion. I am long DBC.
