The price of Bitcoin returned above the $12 000 mark two days ago. As of this writing, the biggest cryptocurrency is still trading in the vicinity of $12k and the larger uptrend appears to be still in progress. Less than two weeks ago, things were not looking so rosy. Bitcoin (BTC/USD) was hovering around $9500 in late-July. In our opinion, a bearish breakout below $9050 was going to open the door for a much bigger decline. However, as long as $9050 was intact, there was still hope for the bulls. The Elliott Wave chart below, sent to subscribers on July 28th, explains why.

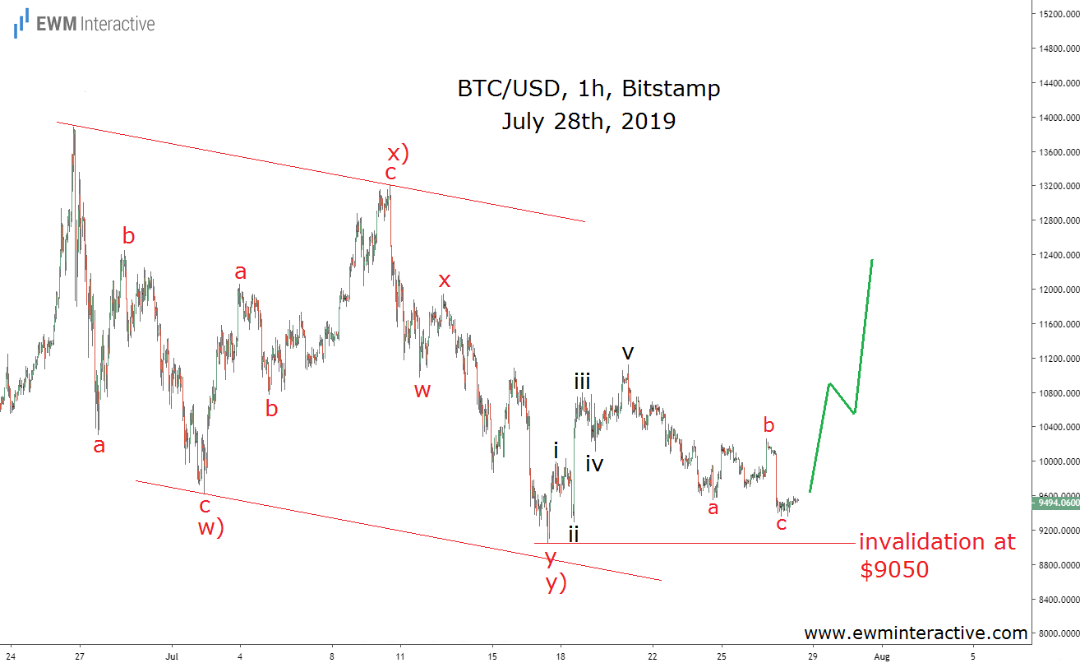
The hourly price chart of Bitcoin revealed that the decline from $13 880 was a w)-x)-y) double zigzag correction. Corrections temporarily interrupt the larger trend. Once a correction is over, the larger trend resumes. In Bitcoin’s case, it seemed the uptrend preceding the double zigzag was ready to continue. There was a five-wave impulse to the upside from $9050 to $11 120, followed by a simple a-b-c zigzag. The 5-3 wave cycle was complete and it made sense to expect more strength in BTC/USD at least as long as $9050 holds. This setup almost failed the very same day.

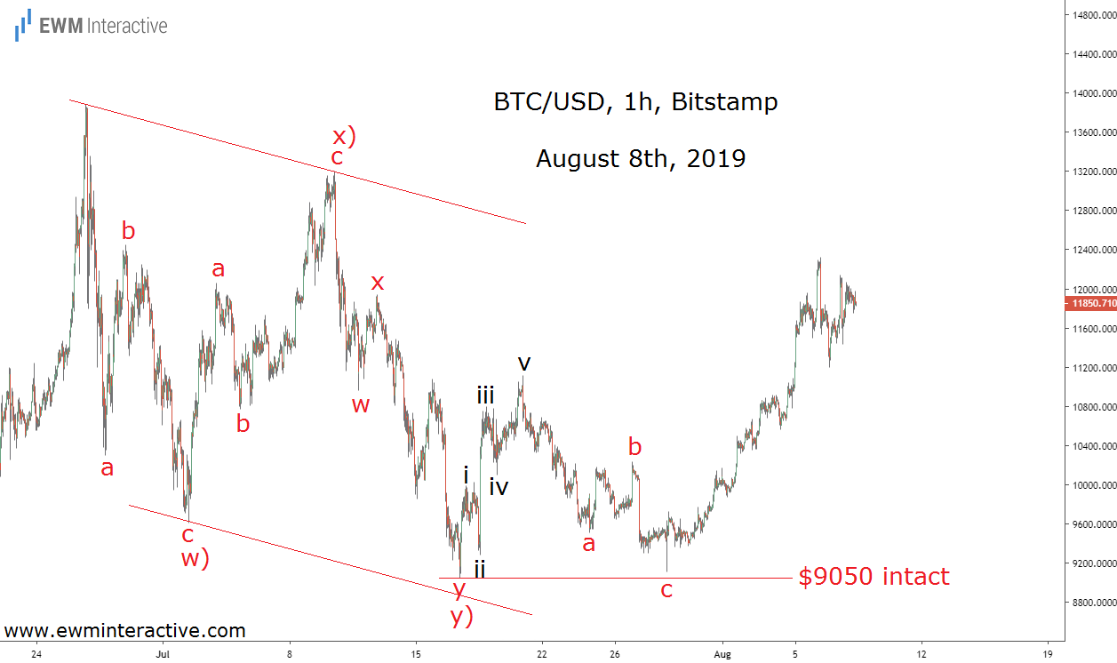
It turned out wave “c” was not over at $9566 as we thought. It soon dragged Bitcoin to as low as $9111. However, above $9050 the odds were still in the bulls’ favor. Fortunately, the positive setup survived. Especially for Bitcoin, which often makes 15% moves in both directions in a matter of hours, $61 usually doesn’t make any difference. On July 28th, though, the empty space between $9111 and $9050 made the difference between a crash and a rally. We will never know what was going to happen had $9050 given up. In our opinion, nothing the bulls would have liked. The point is that the failure or the survival of a key level can make a huge difference in the markets. Elliott Wave analysis’ ability to help traders identify those levels is vital.
What will BTC/USD bring next week?
The price of Bitcoin returned above the $12 000 mark two days ago. As of this writing, the biggest cryptocurrency is still trading in the vicinity of $12k and the larger uptrend appears to be still in progress. Less than two weeks ago, things were not looking so rosy. BTCUSD was hovering around $9500 in late-July. In our opinion, a bearish breakout below $9050 was going to open the door for a much bigger decline. However, as long as $9050 was intact, there was still hope for the bulls. The Elliott Wave chart below, sent to subscribers on July 28th, explains why. The hourly price chart of Bitcoin revealed that the decline from $13 880 was a w)-x)-y) double zigzag correction. Corrections temporarily interrupt the larger trend. Once a correction is over, the larger trend resumes. In Bitcoin’s case, it seemed the uptrend preceding the double zigzag was ready to continue. There was a five-wave impulse to the upside from $9050 to $11 120, followed by a simple a-b-c zigzag. The 5-3 wave cycle was complete and it made sense to expect more strength in BTCUSD at least as long as $9050 holds. This setup almost failed the very same day. It turned out wave “c” was not over at $9566 as we thought. It soon dragged Bitcoin to as low as $9111. However, above $9050 the odds were still in the bulls’ favor. Fortunately, the positive setup survived. Especially for Bitcoin, which often makes 15% moves in both directions in a matter of hours, $61 usually doesn’t make any difference. On July 28th, though, the empty space between $9111 and $9050 made the difference between a crash and a rally. We will never know what was going to happen had $9050 given up. In our opinion, nothing the bulls would have liked. The point is that the failure or the survival of a key level can make a huge difference in the markets. Elliott Wave analysis’ ability to help traders identify those levels is vital. What will BTCUSD bring next week?
Read more at: https://ewminteractive.com/bitcoin-almost-collapsed-last-month
