I’m not going to sugarcoat it: today sucked out loud for me. I actually got stopped out of very few positions, because the “big picture” tops are still cleanly in place, but the huge relief rally we got definitely took a hatchet to my portfolio profits. Since I’m always happy to share success stories, I thought I should at least be as eager to share something less gleeful. So there you have it.
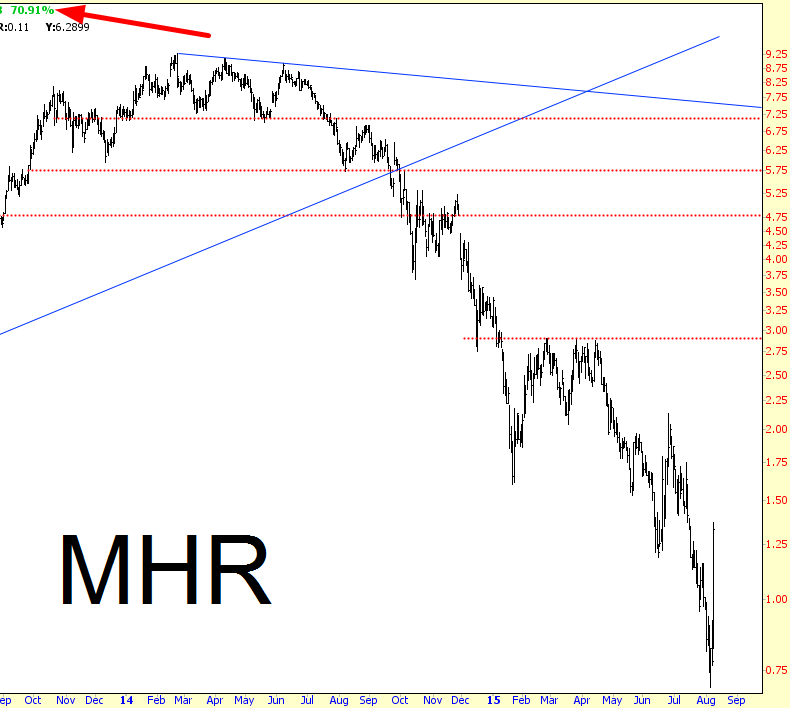
Having said that, I have been asking myself: how big is this relief rally (which I think is largely going to be driven by the relief-in-commodities rally) going to be? Traders more nimble than yours truly definitely benefited from the bounce of some horribly-oversold issues, such as Magnum Resources, which jumped 70% today alone (!)

Just looking at that chart, though, you can see the cascading waterfall of lower lows and lower highs. There have been plenty of rallies in past months, and each one has been met with renewed selling that drove prices to even lower levels.
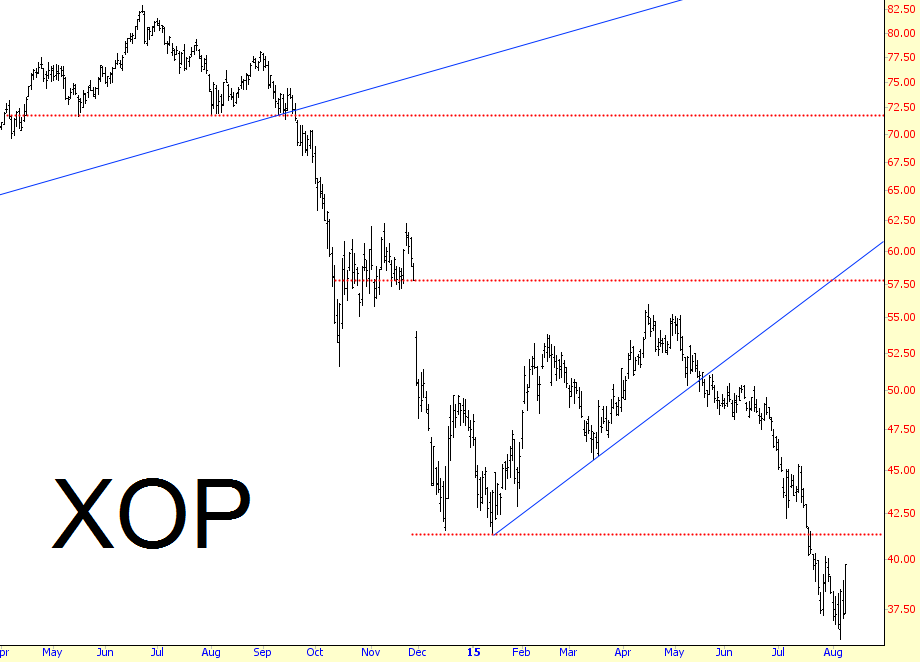
Looking at the oil and gas explorers, for instance, today’s nearly 7% rally (many times bigger than the likes of SPDR S&P 500 (ARCA:SPY), PowerShares QQQ Trust Series 1 (NASDAQ:QQQ), and iShares Russell 2000 (ARCA:IWM)) was great for the bulls, but here again you can see that it’s simply going to hit its head on what I consider a substantial amount of overhead supply, demarcated by the lowest red line you see here:

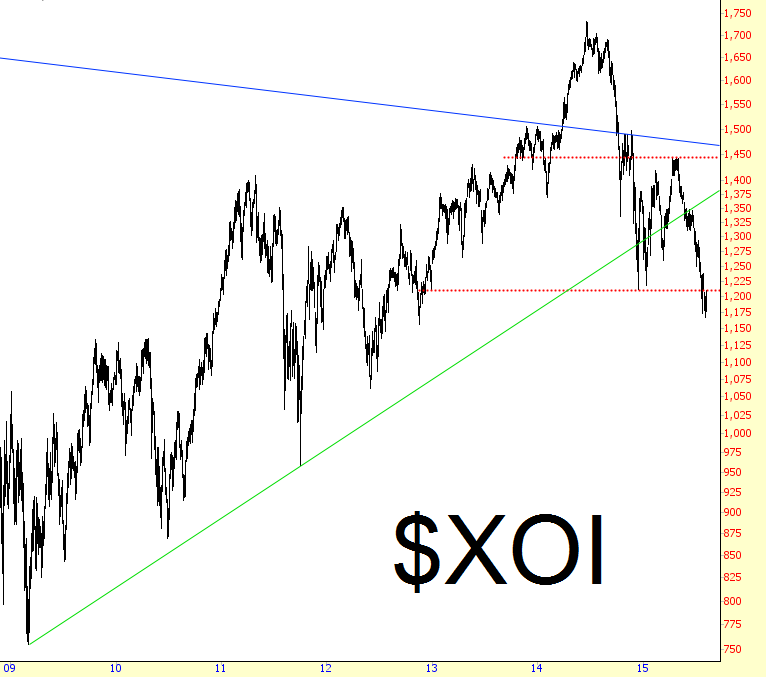
Another way to look at this is by way of the oil and gas index, ARCA Oil, which has been violently lurching lower for many months. I will concede that the red line may not be the firm brick wall that I’d like it to be – – prices may keep flying from terribly-depressed states – – but looking at the big picture, I don’t think anyone could plausibly argue that this is a setup for a meaningful rally. It’s simply countertrend.

Of course, this could all be wishful thinking. After all, we now live in a world where the biggest financial news is that a huge technology leader has decided to change to one of the goofiest corporate names ever conceived.
