The latest Federal Reserve flow of funds data provides an up to date view of households' current asset allocation. Let's review.
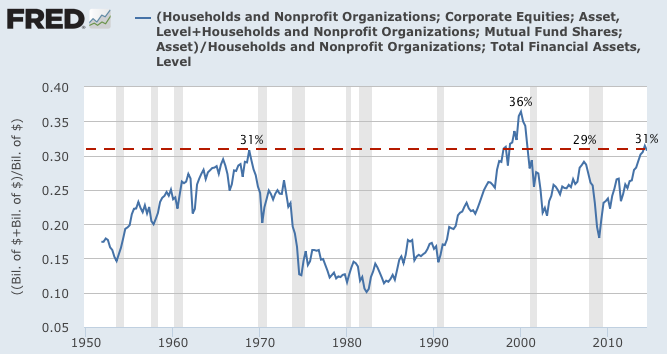
Household's largest holding is in equities; these comprise about 31% of their total financial assets. It troughed at 18% in early 2009. Current levels are above the recent highs of 29% in mid-2007. In 2000, it was an all-time high of 36%.
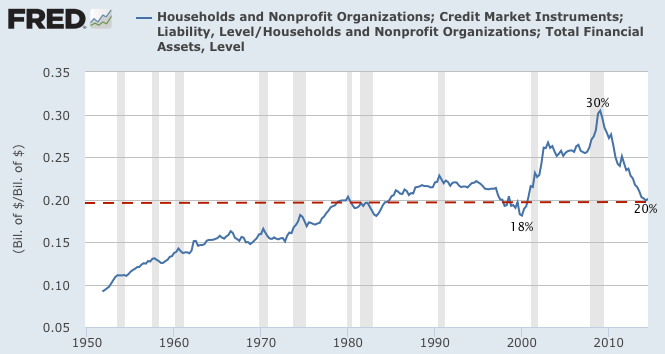
Treasury, corporate and muni bonds are about 20% of household financial assets. It peaked at 30% in early 2009. Current levels are near the most recent bottom of 18% in 2000.
Checking and savings deposits and money market funds (cash) are about 15% of household financial assets. It peaked at 18% in early 2009. Current levels are near the most recent bottom of 14% in mid-2007. In 2000, it was an all-time low of 12%.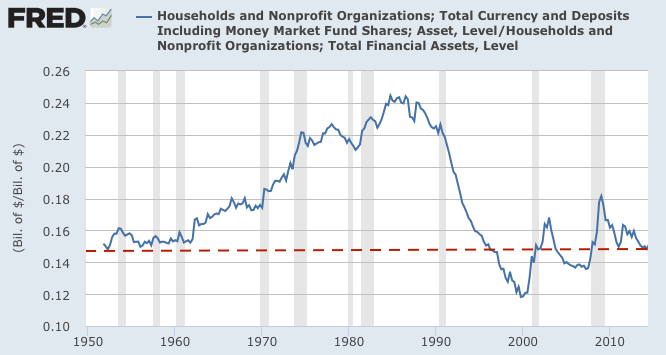
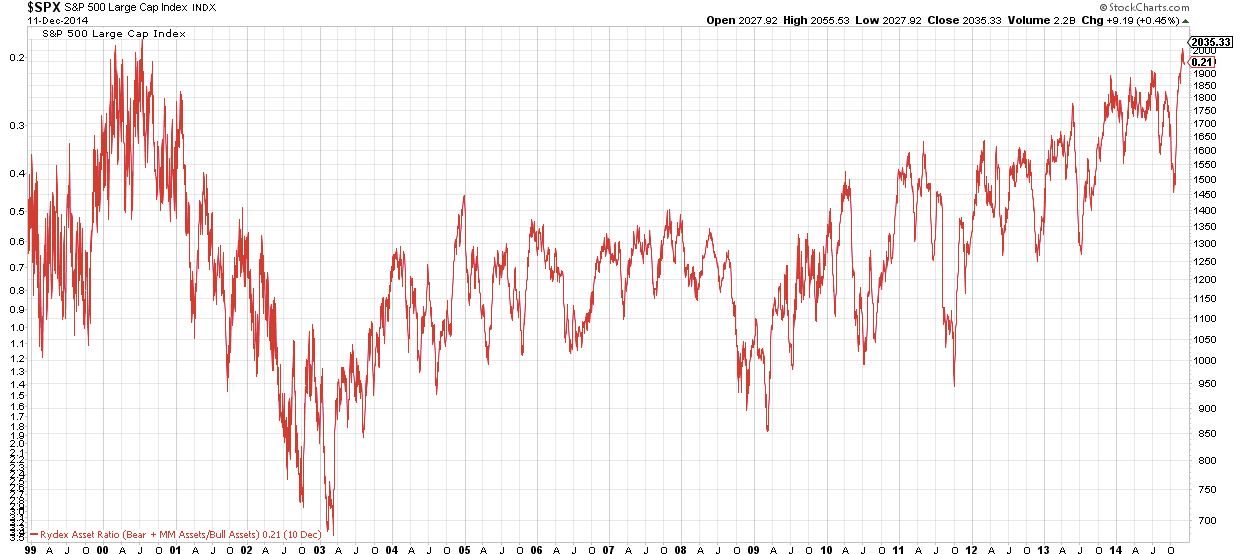
Net, households have a strong preference for equities over bonds and cash. These results should not be surprising; Investor's Intelligence shows that investment advisors are bullish equities by a 4:1 margin. Moreover, investor's relative holdings of Rydex assets that are bullish on equities are back at their 2000 peak.
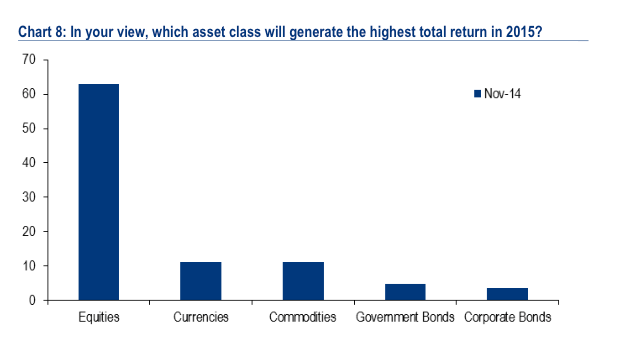
It's not just individuals that have a preference for equities and a disdain for bonds. BAML polls fund managers each month; in November, their preference for equities was about 6 times greater than that for bonds.
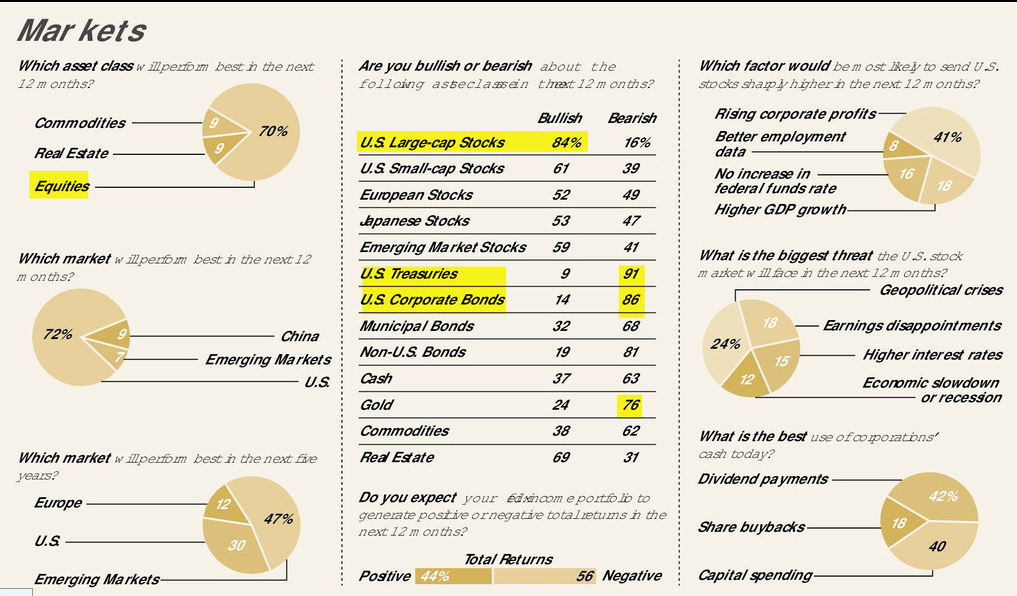
And the WSJ also polled "big money" managers recently; 84% are bullish equities and about 90% are bearish bonds.
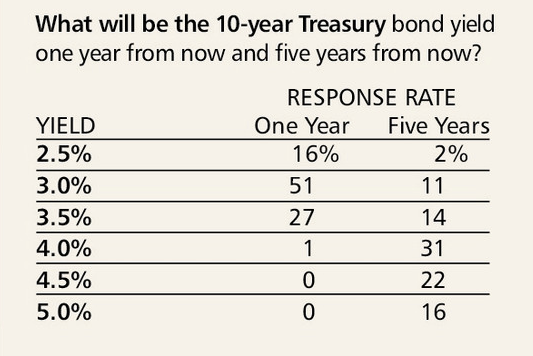
95% of those in the WSJ poll see 10-Year yields over 2.5% by the end of 2015. Yields are currently 2.18%.
We're not sounding an alarm. But investors, both large and small, are positioned for and expecting equities to be the big winner and bonds to be the big loser in 2015. Contrarians should take note.
