Sometimes it's interesting how macro trade setups line themselves up. Right now, one of the crowded macro trades seems to be long US dollar and, by implication of their negative correlations, short commodities. So what happens if this trade were to reverse itself? What would be the implications for the markets in general?
A crowded long (and short)
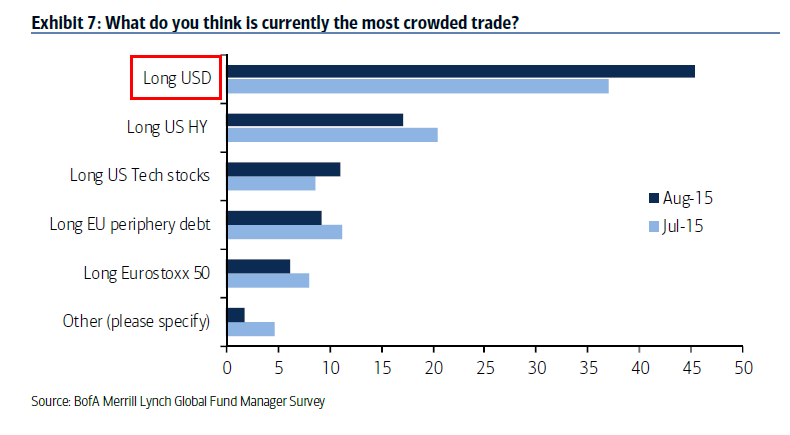
First, let`s consider what the crowded trades are. Here are the results of the BoAML Fund Manager Survey, which surveys a sample of mainly globally oriented institutional fund managers. The consensus crowded long is long USD.
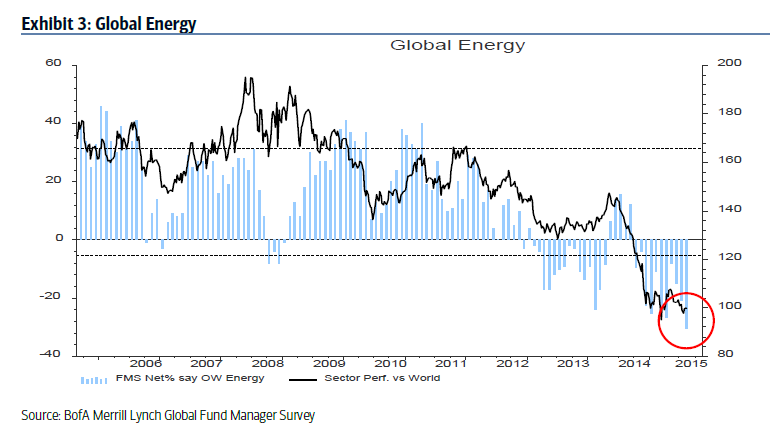
Since the USD and commodity prices are inversely correlated, it was therefore no surprise that global equity fund managers were hugely underweighted in the energy sector.
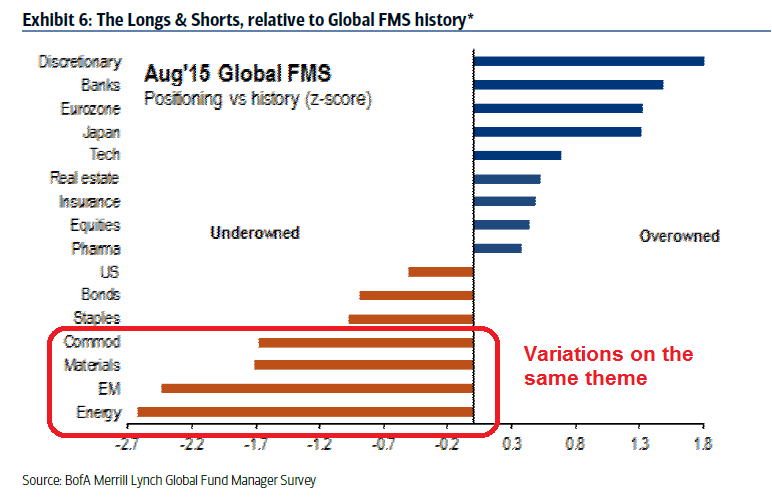
When we analyze sector weightings, the global sample shows that equity managers were underweight energy, materials, commodities and emerging markets, which are all correlated to each other.
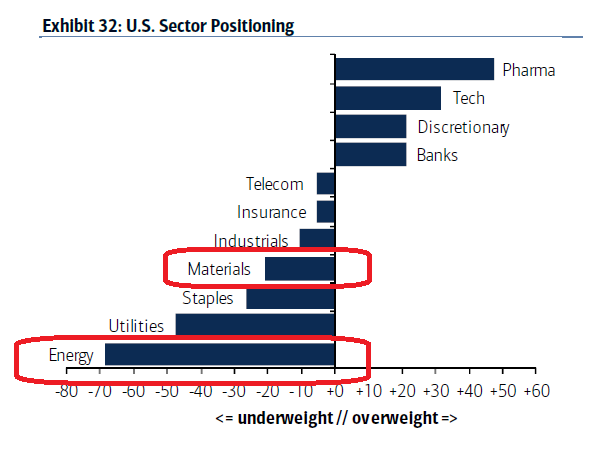
The US sector positioning was more or less the same, namely a huge underweight in energy and materials, which is a very small sector by weight.
Gold and oil poised to rally
However, note the technical internals of oil and gold, gold is trying to bottom and oil may not be that far behind, while the USD Index has been stuck in a tight trading range since March.
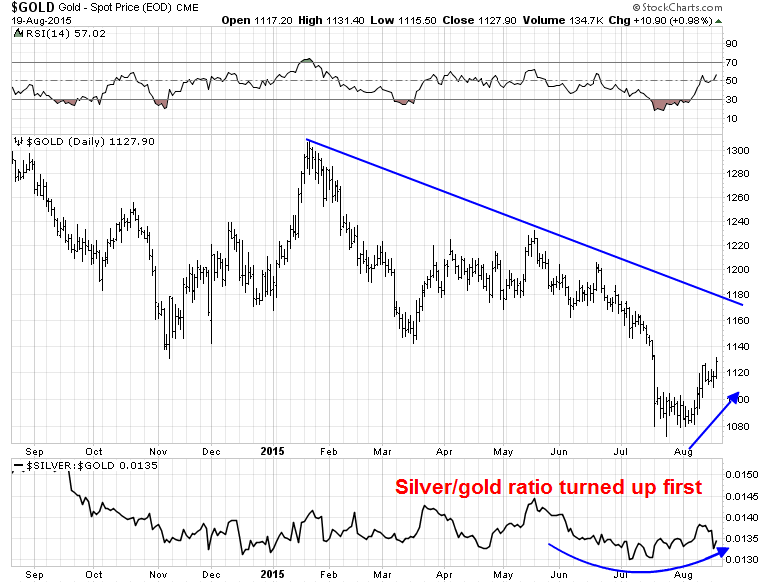
Here is the chart of gold. The silver/gold ratio is shown in the bottom panel. Note how higher beta silver bottomed before gold did, indicating selling exhaustion. Even though gold remains in a long-term downtrend, the metal was highly oversold and it has room to stage a counter-trend rally all the way up to the 1160-1180 level.
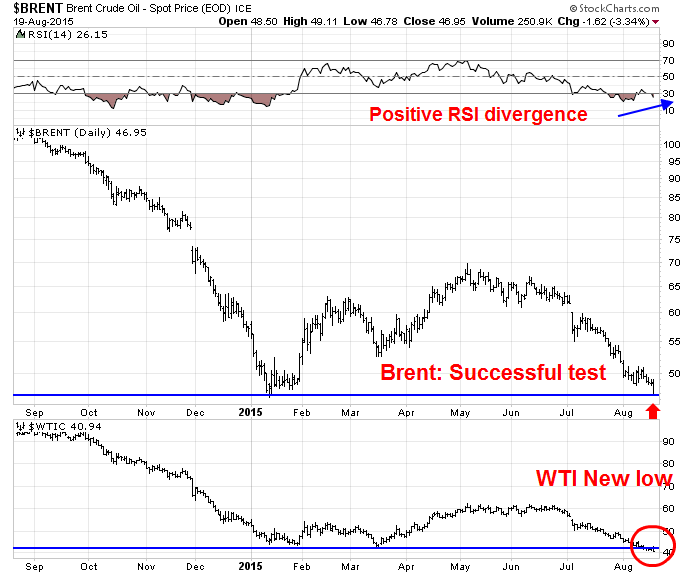
Here is the chart of crude oil. I have shown the charts of Brent, which is arguably more reflective of the world price of oil and does not have the transportation issues of WTI, in the middle panel and WTI in the bottom panel. Brent sustained a successful test of technical support while exhibiting positive RSI divergence, while WTI fell to new lows for this cycle.
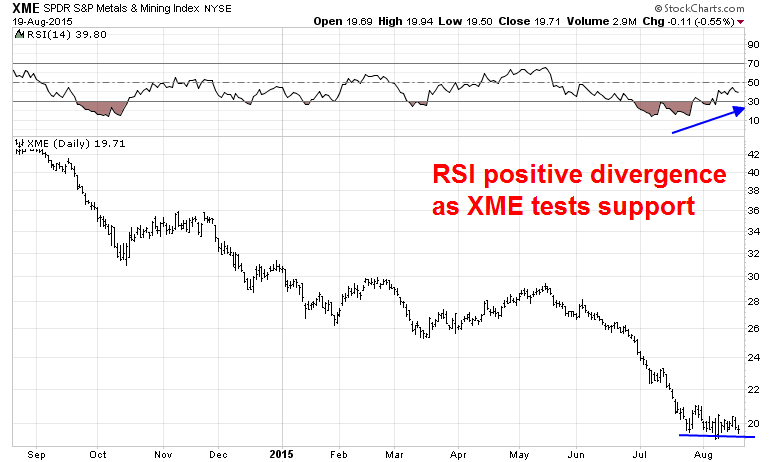
The charts of resource equities are telling a similar story. The chart of Metals and Mining stocks (via SPDR S&P Metals & Mining ETF (NYSE:XME)) below show that this industry group is testing a key support level, but market internals are positive as it is experiencing a positive RSI divergence.
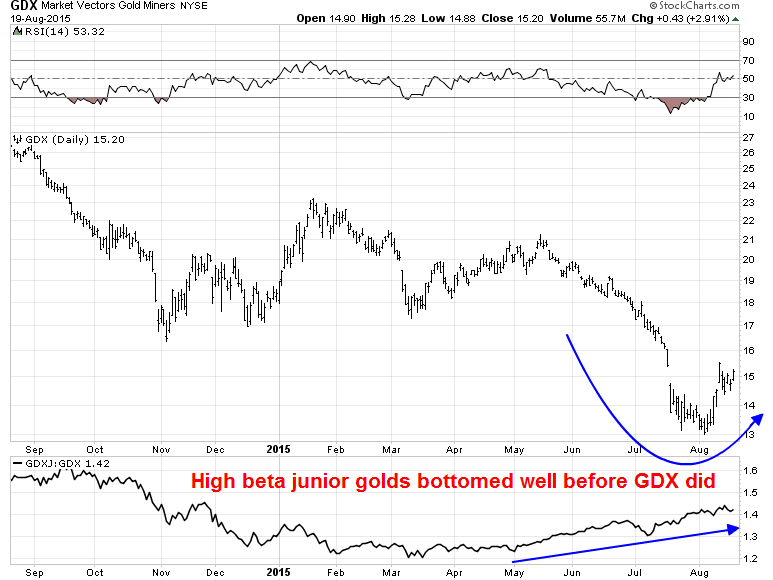
Here are the gold stocks. The ratio of the higher beta junior golds (Market Vectors Junior Gold Miners (NYSE:GDXJ)) to senior golds (Market Vectors Gold Miners (NYSE:GDX)) is shown on the bottom. The high beta juniors bottomed out well before the seniors, indicating that selling exhaustion had set in, much in the manner of the silver/gold ratio.
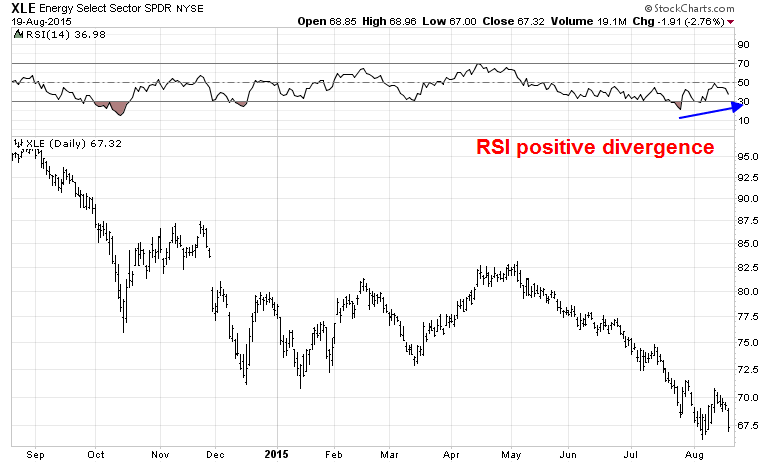
The chart of the energy stocks below (Energy Select Sector SPDR (NYSE:XLE)) are showing two forms of positive divergence. Despite the new lows seen in WTI yesterday, energy equities held up and did not breach their lows. As well, the RSI positive divergence is another bullish sign.
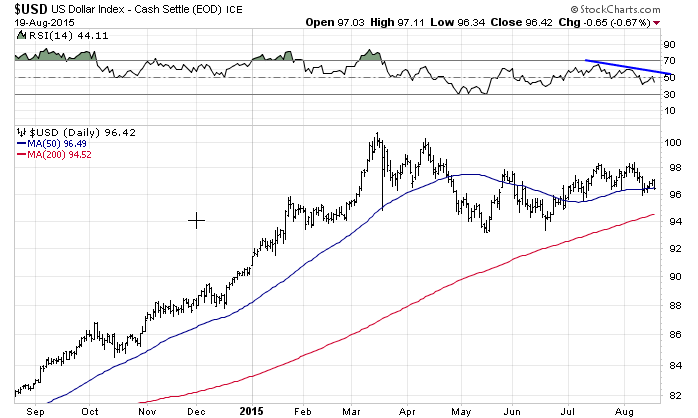
While the technical internals of commodities and resource stocks are exhibiting blatantly bullish tendencies, the USD Index chart is not as obviously bearish. The USD Index peaked out in March and has been moving sideways every since. Some minor bearish signs can be seen as the USD Index did breach its 50 dma today and RSI appears to be trending down, which indicates deteriorating momentum. However, these are not decisively bearish signals in the way that resource stocks appear bullish.
What if commodities rally and the USD weakens?
Supposing that the commodity complex were to stage a counter-trend rally for the next few months, what are the likely implications?
Strength in commodity prices would likely mean USD weakness by virtue of their inverse relationship. Assuming that the FOMC were to raise rates at their September meeting, the market would then focus on the pace of future rate hikes. Would there be another rate hike in December?
This is where I believe the markets could force the Fed's hand. The Federal Reserve has made noises in the past about its concerns about the strength of the US dollar. A rising dollar is a form of de facto tightening by importing deflation and a weakening dollar would import inflationary pressures. Dollar weakness therefore puts upward pressure on inflation and a faster pace of rate hikes becomes more likely.
The bond market could very well freak out.
Matt Busigin wrote the following comment in 2013 about what to expect when the Fed raises rates, but his comments are still applicable today. He referred to the key 2012 Jackson Hole paper by Michael Woodford, Methods of Policy Accommodation at the Interest Rate Lower Bound. Busigin cited historical studies indicating that stocks tended to rise when the Fed raised rates, but there was a caveat to the analysis (emphasis added):
The mean monthly total return of the SP 500 is 0.65%. That return drops, but is still positive when the Fed Funds rate increases, to 0.45%. However, when the term premium between the 10y and Fed Funds rate is positive, the average return returns to 0.64%. When the term premium is above 1%, the average return is even higher than the sample mean – 0.82%! When adding the condition that the benchmark rate falls, the mean monthly return climbs to 1.27%. This tells us something very significant to the discussion: the price of SP 500 contains the expectation of monetary policy. Thusly, monetary policy tightening has not negatively impacted the SP 500 unless it happens more quickly than the market expects. In fact, both the 10y and the equity market don’t necessarily negatively react to Fed Funds hikes.
If commodity prices were to rise and the USD falls, then it would change market expectations about the likely trajectory of Fed policy, which would become more hawkish. Both the bond and stock markets wouldn't like that at all.
For a more empirical view, Urban Carmel took a stab at what happens after the first Fed rate hike. He found that the market response varied, but there were some commonalities. Stocks tended to rally into the rate hike, sell off and then rise again (emphasis added):
In all 6 cases, US equities rose in the 3 months ahead of the first rate hike (on the right side of the chart above). Note that $SPX sold off by at least 5% in the months after the last 4 rate hike cycles began. So, to generalize, stocks rally into the expected first rate hike, then sell off and then rally again.
Treasury yields tended to rise after the first rate hike:
Treasury yields rose after each rate hike (meaning: prices fell). The positive returns (first chart in this post) come from their offsetting coupon payments.
Interestingly, yields were flat or rising in the 3 months ahead of the first rate increase. In contrast, 5, 10 and 30 year yields have now declined over the past 3 months, and 2 year yields are flat. The set up is different now then it is normally.
Rate hikes generally occurred in commodity bullish environments (because commodities rise when the economy is expanding and demand growing), but the setup this time is different as commodities have been falling into the FOMC decision:
On average, commodities were the best performing asset class after the first rate hike. Again, this should make sense since an improving economy implies demand for industrial metals and energy. In fact, commodity prices had already been rising ahead of the first rate increase. Which makes today's situation, where energy and industrial metals are falling, very different.
What about earnings?
Based on my analysis so far, I can anticipate readers asking, "What about the positive effect on earnings when the USD falls?" After all, unfavorable currency translation has proven to be a headwind for the earnings of many US multi-nationals. Shouldn't a falling dollar be earnings positive?
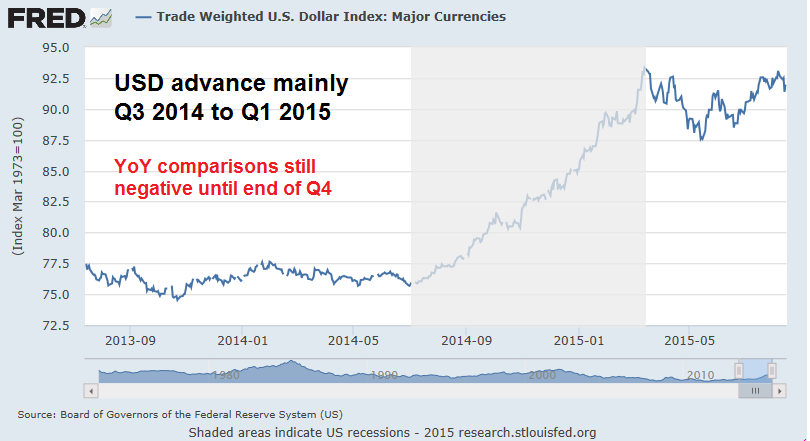
The answer to that question is a qualified yes. The chart below, of the Trade Weighted Dollar, shows that the rise of the USD began about a year ago and peaked in March. The TWD has been mainly flat ever since.
Unless the dollar were to truly crater and retrace most of its gains that began last summer, YoY comparisons of currency translation effects will still be negative for Q3 and Q4 earnings season. While a weaker USD may pose less of a headwind to earnings, it will still be a headwind for the roughly the next two earning seasons. It is unclear, however, how much USD strength is already baked into Street EPS estimates and therefore the effects of dollar weakness on expectations is uncertain.
A September correction?
So let's set up the scenario. Gold, oil and other commodity prices rally from their oversold positions. It should not matter for the next several months whether this is the start of a sustained bull or just a bounce in a downtrend. At the same time, the US dollar takes a breather and retreats against major currencies. From a technical perspective, these moves are overdue because of the crowded short in commodity and commodity-related stocks and a crowded long in the USD.
Supposing that the Fed raises rates by 1/4 point at its September meeting. The market then asks, "Will they move again in December?"
The falling dollar changes market expectations about the pace of tightening, though whether it necessarily forces the Fed's hand will be a matter for debate. The key point is that market expectations will have shifted about the trajectory of changes in short-term interest rates.
The bond market sells off on rising inflationary pressures, which then pushes equity earnings multiples downward. Equities then correct over the next few months.
This is not necessarily my forecast, but it does show how macro forces that begin with an oversold rally in gold and oil could spark a stock market correction. The key signposts to watch over the coming weeks are:
- The US dollar;
- Commodity prices; and
- The September FOMC decision.
As an investor, I work with possible market scenarios and then estimate their likelihood. A commodity sparked correction in stock prices is a possibility that we need to keep in mind.
Disclosure: Cam Hui is a portfolio manager at Qwest Investment Fund Management Ltd. ("Qwest"). This article is prepared by Mr. Hui as an outside business activity. As such, Qwest does not review or approve materials presented herein. The opinions and any recommendations expressed in this blog are those of the author and do not reflect the opinions or recommendations of Qwest.
None of the information or opinions expressed in this blog constitutes a solicitation for the purchase or sale of any security or other instrument. Nothing in this article constitutes investment advice and any recommendations that may be contained herein have not been based upon a consideration of the investment objectives, financial situation or particular needs of any specific recipient. Any purchase or sale activity in any securities or other instrument should be based upon your own analysis and conclusions. Past performance is not indicative of future results. Either Qwest or Mr. Hui may hold or control long or short positions in the securities or instruments mentioned.

