While residential investment represents a small portion of gross domestic product (GDP), housing is perhaps one of the most cyclical sectors of the economy and tends to lead economic swings by months to years. As such, keeping a close eye on housing provides a valuable insight into future economic trends. While housing represented a major headwind to the economy after the housing bubble burst, as I show below, it is now providing a major tailwind instead.
At the peak, in 2005, housing represented 6.26% of GDP, the highest level seen in over a half century. Once the housing bubble burst and things came to a standstill, housing activity relative to GDP fell to levels never seen before and hit a low of 2.22% in early 2011.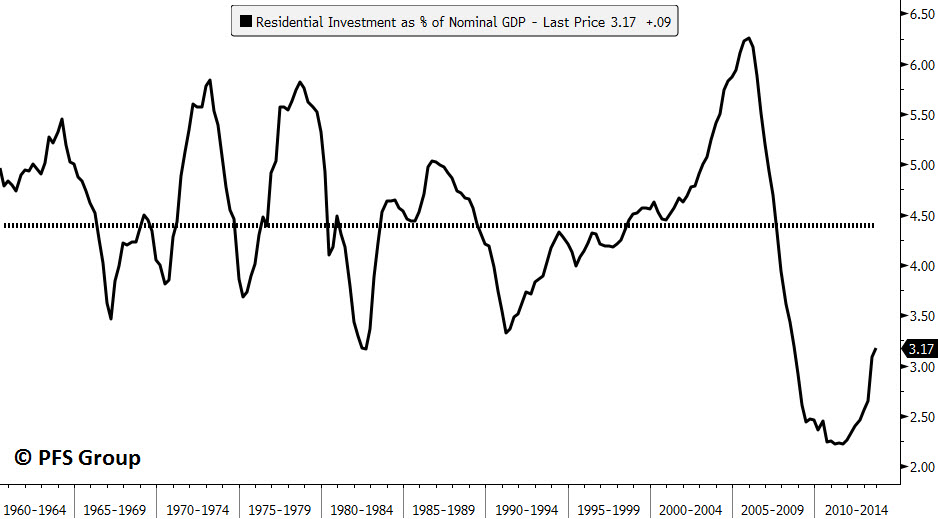
After the late 2005 peak, housing’s positive contribution to GDP began to decline and by the middle of 2006 began to subtract from GDP. Then, from late 2006 through much of 2009, housing was shaving roughly 1% off of GDP. As housing began to stabilize in 2010 and 2011, it stopped dragging the economy down and, beginning in 2012, actually started adding to GDP growth. As of last year, 2013, housing has added roughly 0.40% to GDP each quarter and now represents a tailwind to the economy.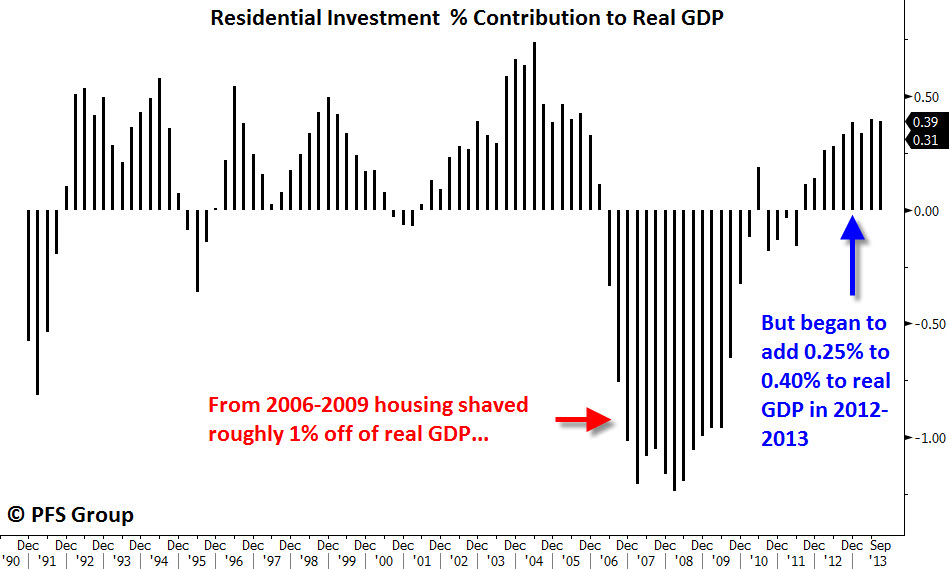
The current improvement in the housing sector is no small thing since it plays such a key role in the economy. As such, it also acts as a leading economic indicator. A pickup in housing activity is followed by improvements in many other areas of the economy down the road. One direct beneficiary of this is state and local governments—an area that has also been a drag on the economy as they've been forced to tighten their belts and cut back on expenditures.
Historically, home price increases lead property tax revenue increases by four years, and based on the rise in home prices over the last few years the growth in state and local property tax revenues is likely to rise from the current 1.6% annual growth rate to 10% growth by the middle of 2016.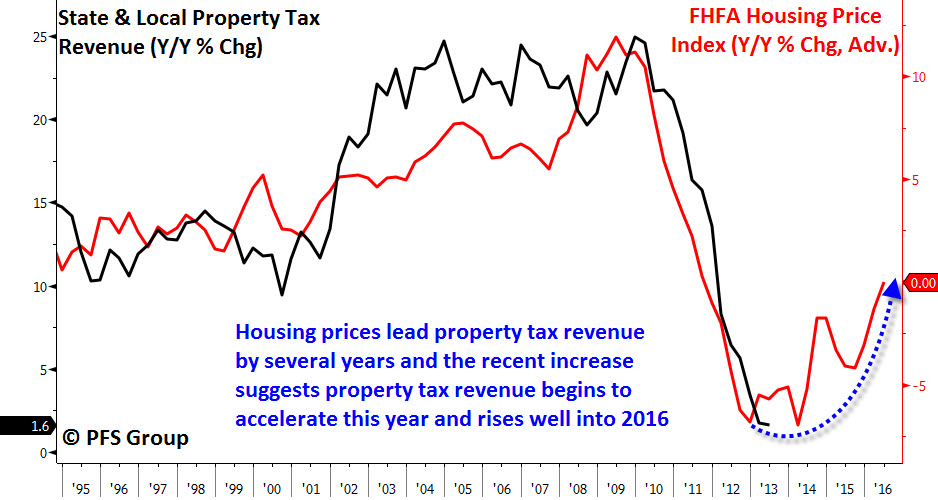
The recent stabilization in property tax revenue and ongoing recovery in housing and other areas of the economy are beginning to turn around the financial situation of state and local governments as this Bloomberg article illustrates. U.S. states are cutting taxes and increasing spending as the improving economy lifts their revenue, marking a recovery from the financial strains that persisted after the recession.
Spending by state governments is set to climb 3.8 percent to $722 billion during the current budget year, the fourth straight annual increase, according to a report released today by the National Association of State Budget Officers. With more money on hand, 23 states cut taxes or took other steps that reduced revenue, and 42 boosted funding for schools.
“State fiscal conditions are modestly improving,” the Washington-based budget officers group said in the report. “Signs of fiscal distress continue to subside, and most states expect revenue and spending growth in fiscal 2014.”
The financial gains are lifting a drag on the economy after the 18-month recession that ended in 2009, during which states eliminated jobs and cut spending to make up for declining revenue. In the six months through September, U.S. economic growth advanced partly because of increases in state and local government spending, according to the Commerce Department.
This year, 16 states faced shortfalls totaling $6.4 billion. That’s down from $37 billion a year earlier, according to the budget officers’ report. For the next fiscal year, ten states are forecasting shortfalls, amounting to $4.4 billion.
As housing represents the largest financial asset for consumers, swings in housing prices are also correlated with swings in consumer sentiment. Even though the recession ended in the middle of 2009, consumer sentiment, as measured by the University of Michigan Consumer Sentiment Index, remained near multi-decade lows. It was only after housing prices stabilized in 2010 that sentiment began to improve. 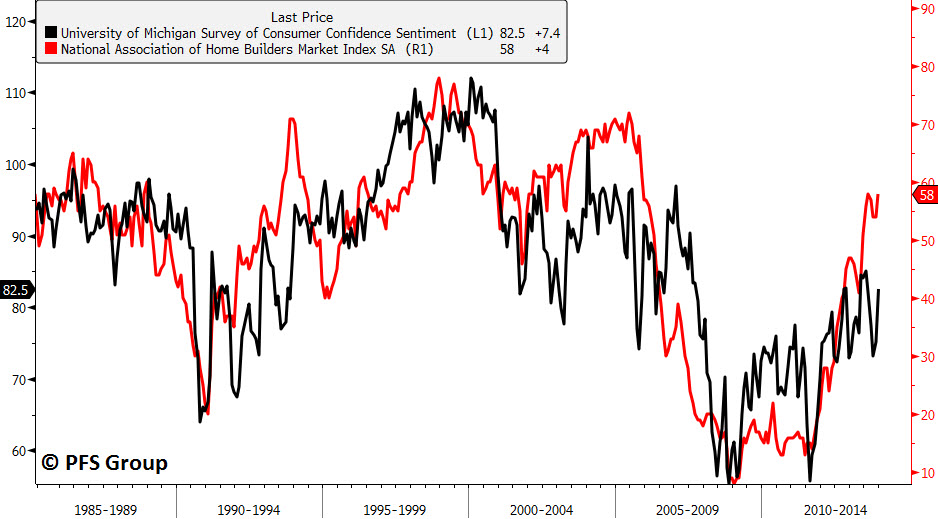
An improvement in consumer sentiment is important since rising consumer confidence is associated with rising levels of consumer spending. Given consumption is more than 70% of GDP, the domino effect of rising home prices translates into higher consumer sentiment which then leads to greater consumption and then to higher GDP growth. This linkage can be easily seen below with the high correlation between the Michigan Consumer Sentiment Index (black line), consumer consumption (red line), and GDP growth rates (blue line).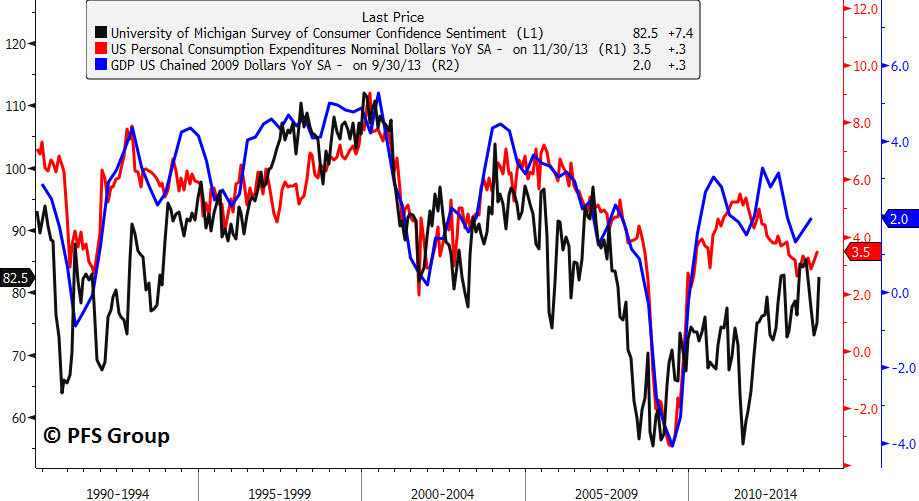
The one negative thing to keep in mind about housing is that it represents roughly one third of the Consumer Price Index (CPI) and housing prices tend to lead owner’s equivalent rent by more than a year. As seen in the image below, the owner’s equivalent rent component of the CPI Index is set to begin rising this year and accelerate into 2015. This will be an important watch-point going forward.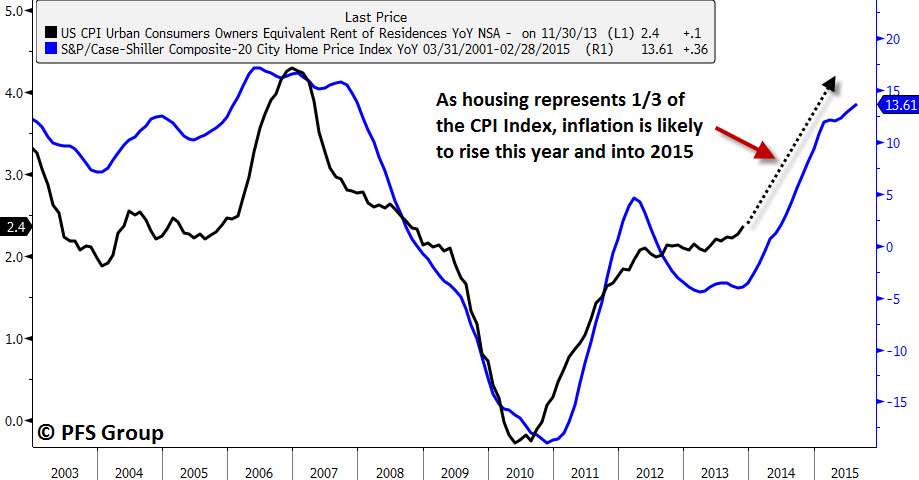
Summary
Since 2005, housing has swung from one side of the pendulum to the other and since 2010 has begun a slow and gradual healing process. Housing is now adding to GDP growth and replenishing state and local government coffers through higher property taxes and leading to an improvement in consumer sentiment. The greater level of optimism seen by the consumer will translate into higher consumption rates and thus higher GDP rates. At the current 3.17% share of GDP, housing is still well below the historical 4.4% average and far below prior peaks near 5.5%-6%, and thus will likely continue to be a tailwind for the economy for some time. That said, housing represents roughly a third of the CPI Index and will likely cause inflation rates to pick back up, which should be monitored as it will eat into discretionary spending.