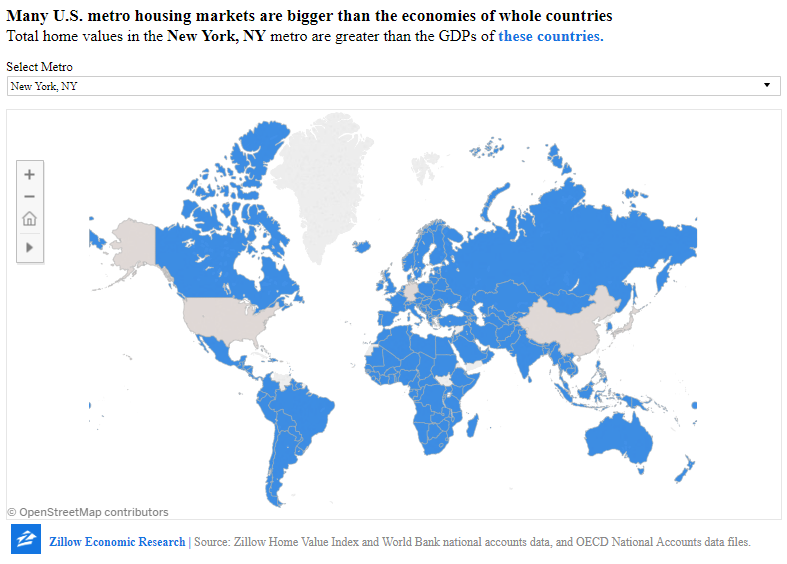
Zillow recently published its 2018 housing market report that showed that America’s $33.3 trillion housing market is up by 49% since 2012:
The value of the U.S. housing market continues to climb, gaining 6.2 percent in 2018 to reach a total value of $33.3 trillion. That’s up $10.9 billion from the bottom of the market in 2012 – and a third of the gain has come in California. The Golden State’s value has climbed $3.7 trillion since February 2012, the nation’s housing-crash low. No other state has gained more than $1 trillion in that same span.
The total value of all homes in the New York metro is the highest among metros analyzed, at $3 trillion – on its own accounting for 9.1 percent of the country’s total housing value. Four of the country’s 10 most valuable markets are in California: Los Angeles, which rose 5.2 percent to $2.9 trillion; San Francisco, up 9.3 percent to $1.6 trillion; San Jose, which gained 10.4 percent to $799.6 billion and San Diego, up 3.4 percent to $673.5 billion.
The housing stock in some pricey metro areas is so valuable, in fact, that the total value in one market often eclipses that of all housing in an entire state. For example, all homes in the Washington, D.C. metro are worth a combined $892 billion – which is more than the values of all homes in 40 individual states, including Colorado ($833.8 billion), Arizona ($708.1 billion), Ohio ($695 billion) and Oregon ($451.8 billion).

As I discussed a few months ago in Forbes, I believe that the post-Great Recession housing recovery is actually an unsustainable boom that was fueled by the Fed. This boom is one of the contributors to the U.S. household wealth bubble –
Since the dark days of the Great Recession in 2009, America has experienced one of the most powerful household wealth booms in its history. Household wealth has ballooned by approximately $46 trillion or 83% to an all-time high of $100.8 trillion. While most people welcome and applaud a wealth boom like this, my research shows that it is actually another dangerous bubble that is similar to the U.S. housing bubble of the mid-2000s. In this piece, I will explain why America’s wealth boom is artificial and heading for a devastating bust.
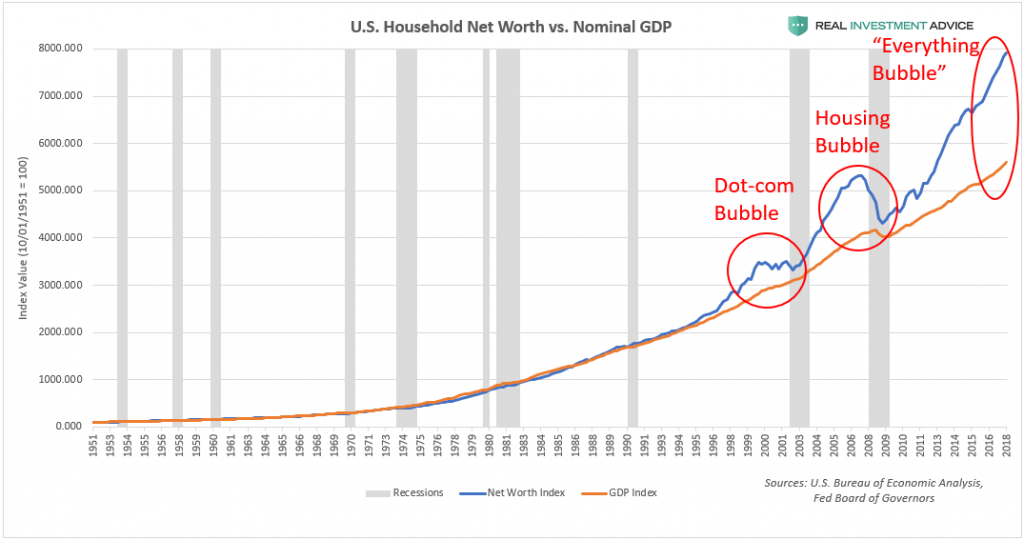
The chart below compares U.S. household wealth (blue line) to the underlying economy or GDP (orange line). In sustainable, organic wealth booms, household wealth tracks GDP very closely. Starting in the late-1990s, however, household wealth decoupled from the GDP as the tech stock bubble helped to inflate American portfolios until it came crashing down in the early-2000s. In the mid-2000s, the U.S. housing bubble boosted household wealth until the 2008 housing crash. Now, here we are in 2018, and the gap between household wealth and the underlying economy has never been larger. This unprecedented gap means that the coming reversion or bust is going to be even worse than the last two, unfortunately.

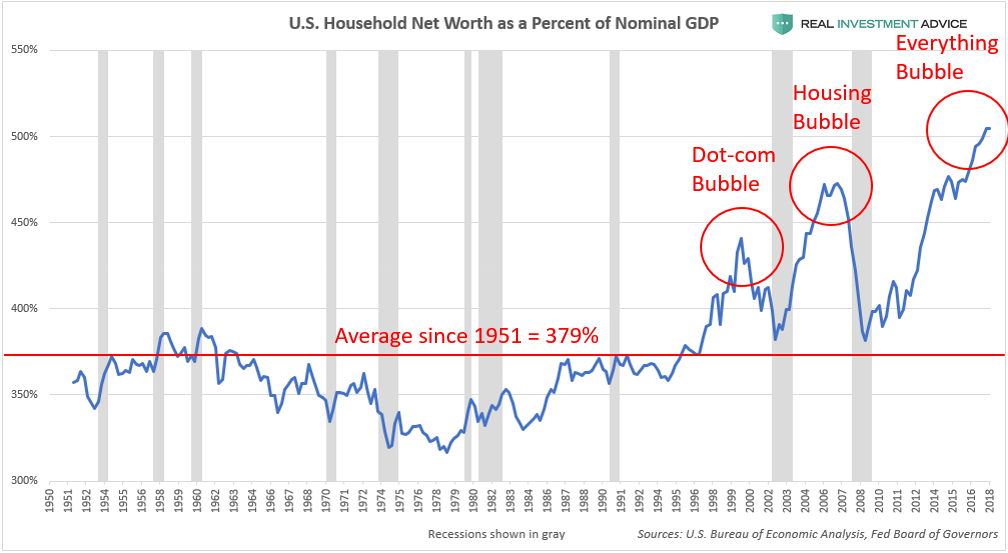
Plotting U.S. household wealth as a percentage of GDP is another way of visualizing the household wealth bubble. Since 1951, household wealth has averaged 379% of the GDP, while the Dot-com bubble peaked at 429%, the housing bubble topped out at 473%, and the current bubble has inflated household wealth to a record 505% of GDP. Interestingly, the 379% average since 1951 is skewed to the upside by the unusually high household wealth since the late-1990s rolling “Bubble Era.” When the current bubble inevitably pops, household wealth may even fall below its historic average in reaction to how stretched household wealth became to the upside.

Unfortunately, I believe that mean reversion is inevitable as U.S. stock and housing prices (and overall wealth) fall back in line with the GDP. This process will be quite painful for the economy because of the reverse wealth effect that it will create (when consumers feel less wealthy, they spend less). Booms created through monetary stimulus always end in a hangover.
