Thursday, there was a relatively large price decline when stocks were sitting near a 52-week high, wiping out a week’s worth of closes. Over the past year, we’ve seen a remarkable 10 such occurrences (according to sentimentrader.com), the most in history. To be specific, these are times when the S&P 500:
- Was within 0.5% of a 52-week high
- In one day, lost at least 0.75%
- In one day, closed below at least the last 5 closes
The M.O.’s really got blasted in the later part of last week, plunging down through the zero line, telling us capital is leaving the market on a net basis. The depth of and angle of the plunge are the notable items! Friday saw 91% of total volume to the down side, with a rare 6.5:1 negative a/d at the close. Often, we see this kind of breadth “overbalance” at the open of a big up or down day, which fades to less than 3:1 by the close. Friday, the breadth got worse by the hour; that’s a new thing. 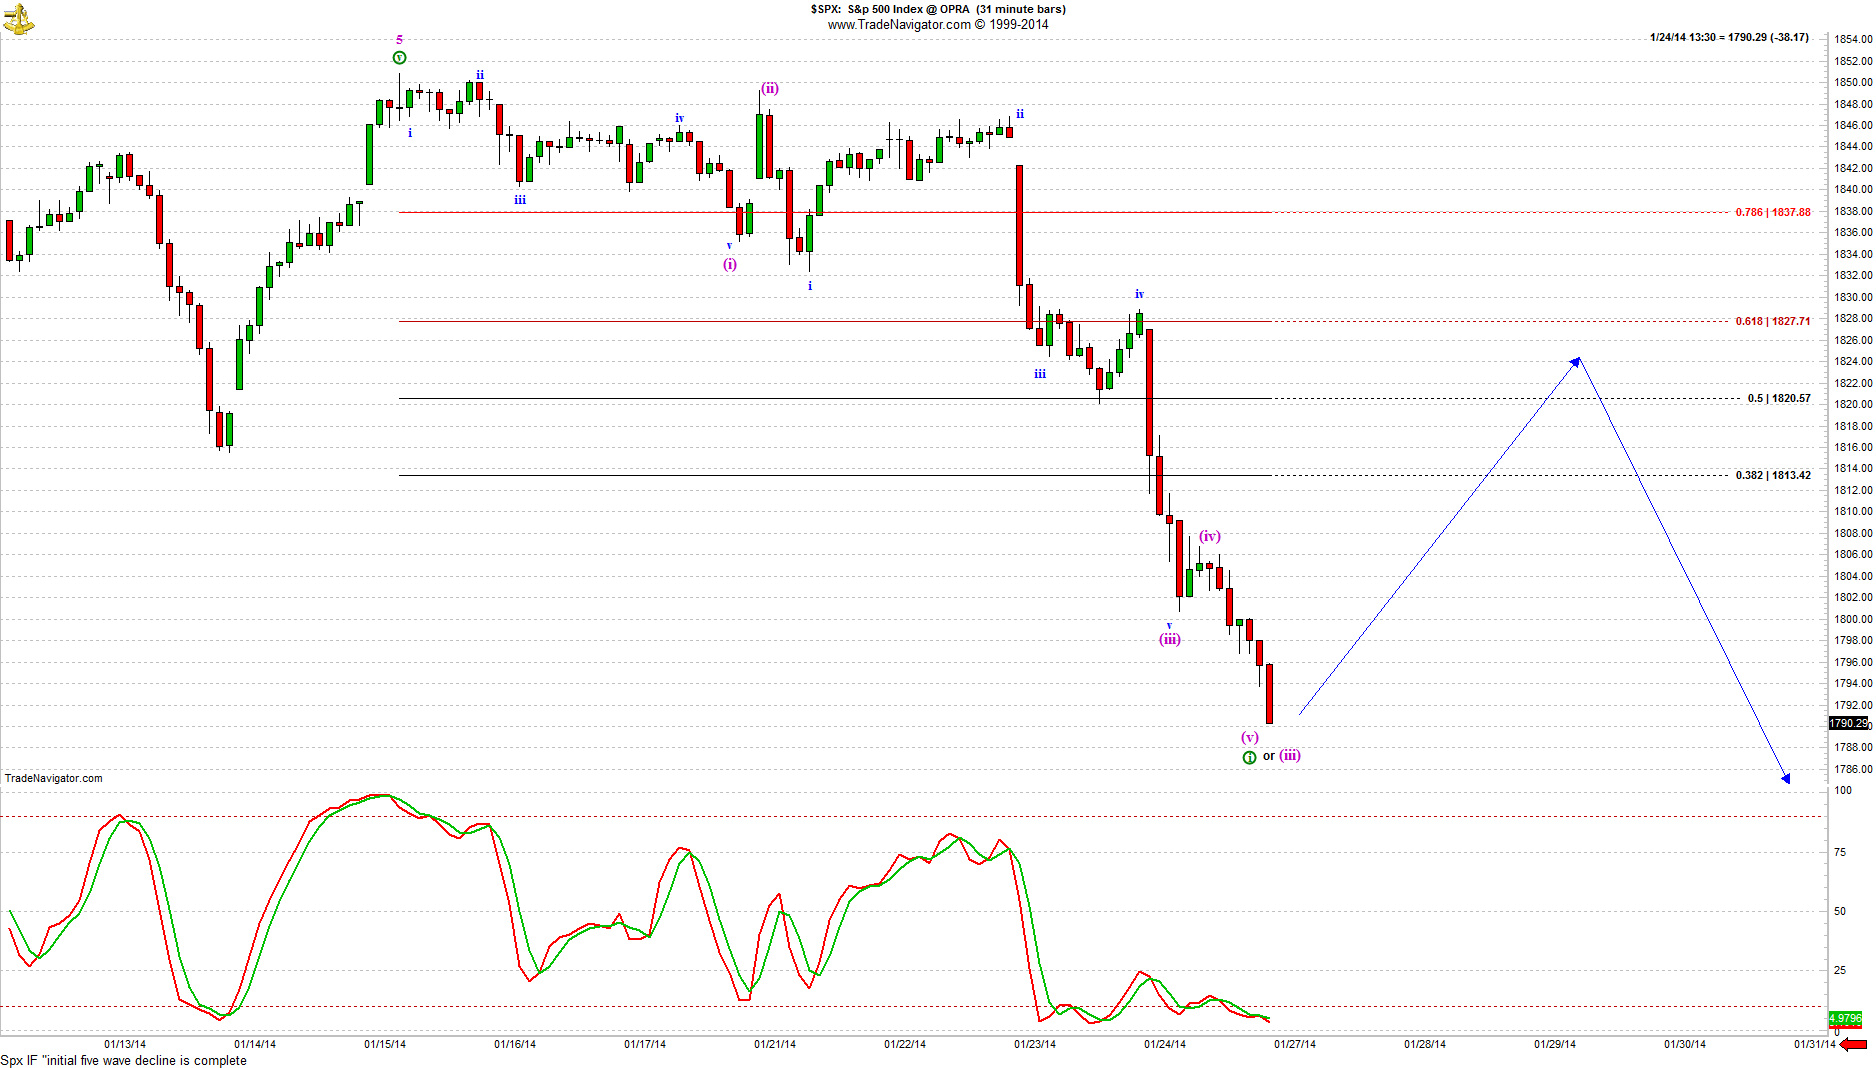
Chart one is the 31 minute bar of SPX if the initial decline from the highs IS complete. This is a new type of charting program, with much more detailed Elliott labeling tools. You can click on the chart to expand, then click on the chart again to zoom in. We’re trying the white background format to see if we like it. Let us know your feedback. If Friday’s close represented only the end of wave (iii), then 1809 +/-5 will be the wave (iv) bounce resistance, and wave (v) of wave i circled will probe 1783 +/-5 in the hours that follow that bounce. IF wave i circled ended Friday, the blue path should ensue, before dramatically lower probes of the 1735 +/-10 zone.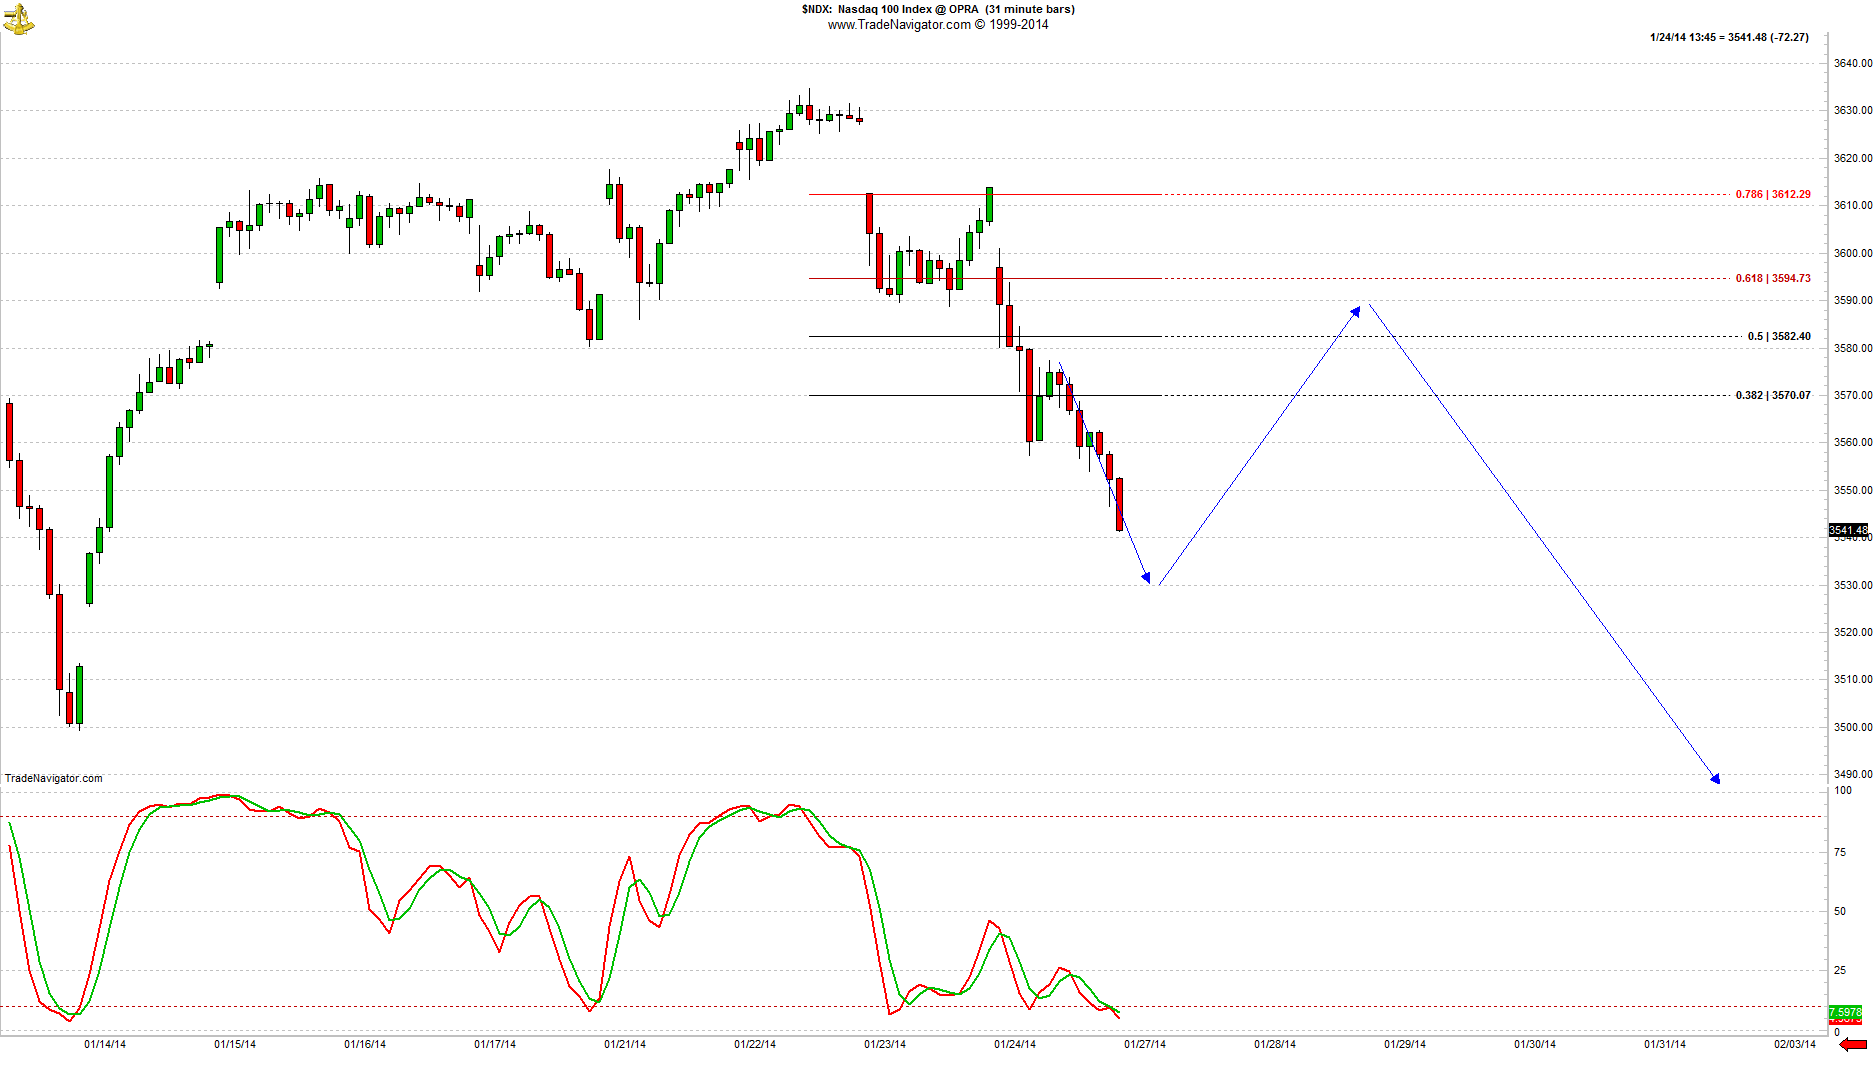
Chart two shows the NDX 31 min, with a slightly lower probe needed to create symmetry between waves (v) and (i); a common expectation, but not required.
Notice the oversold stochs in both charts, which is also present in all intra-day trend degrees we look at. With the daily stochs on all indices are just crossing down last week, now entering “free fall” position. This hints that any bounce should be sold for further declines in price for the next several days, at least. We took profits on profitable NQ shorts into the bell, but will add upon the next bounce. 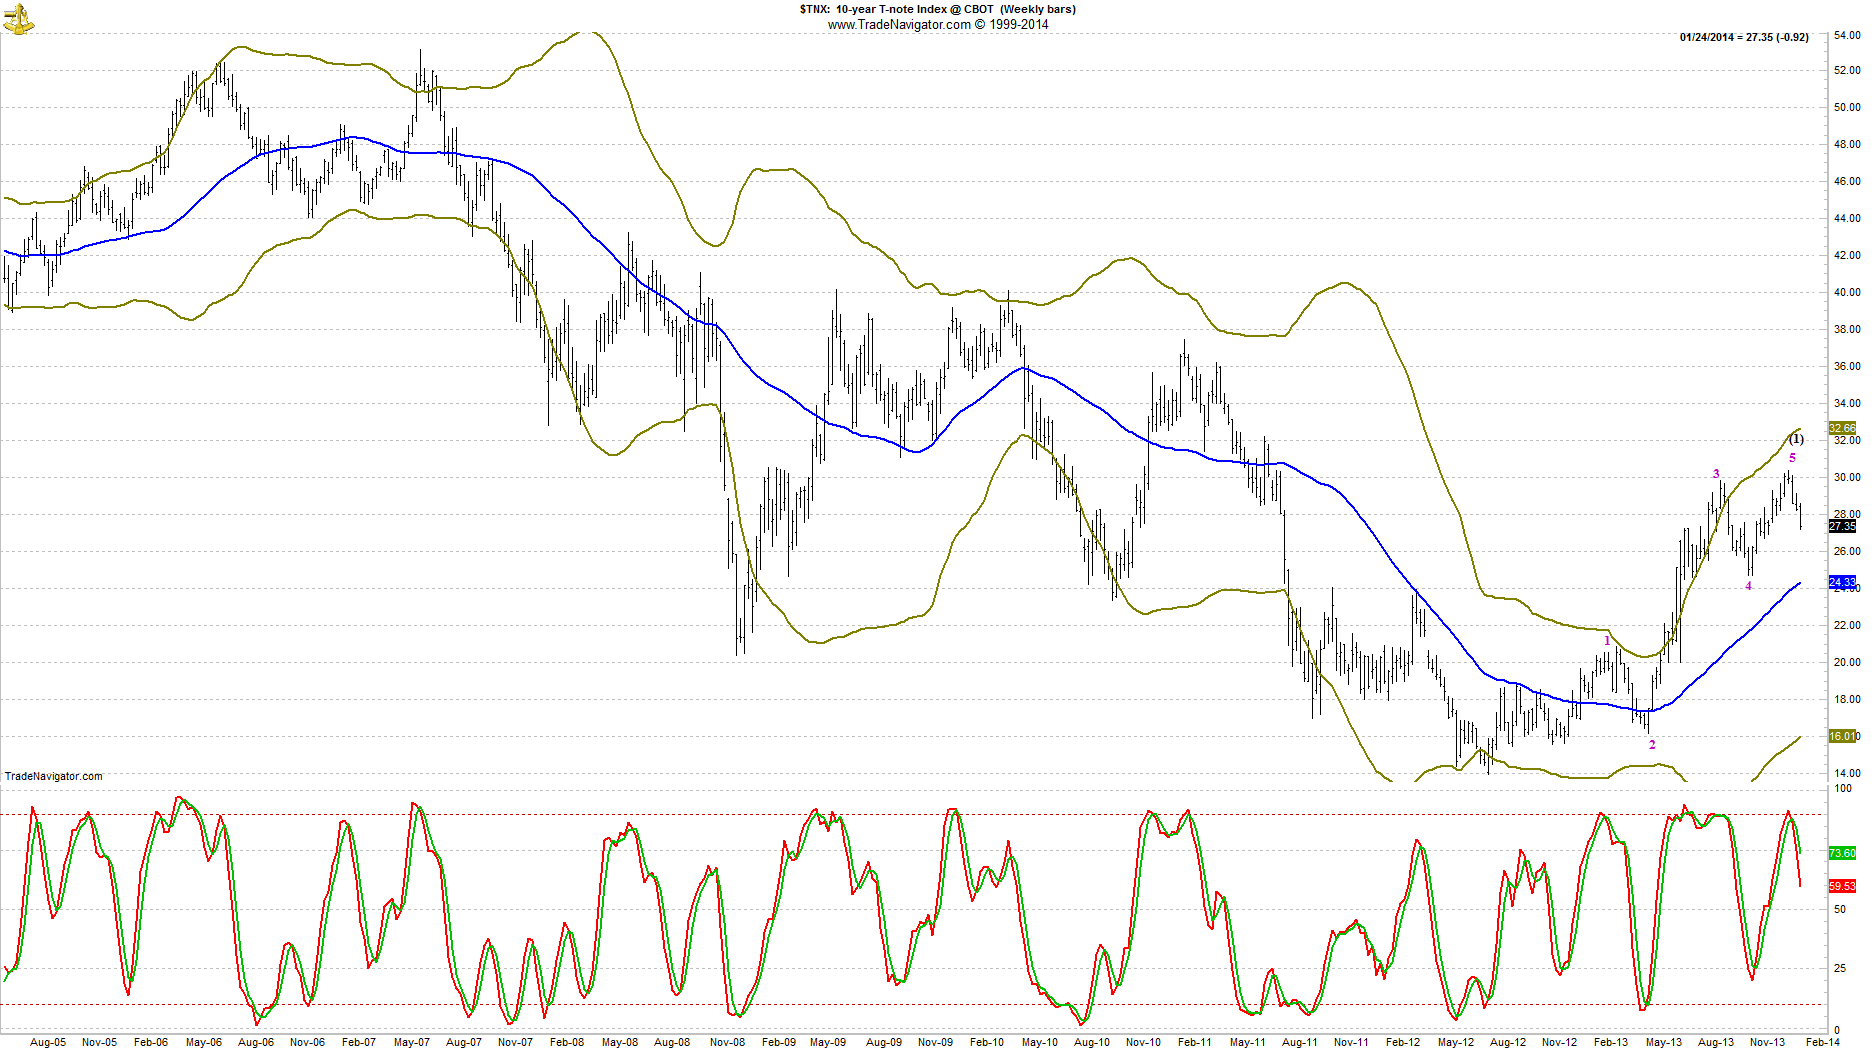
This scenario fits perfectly with the Tbond’s maturing decline in price from the July ’12 peak. Capital now has a safe-haven to flee to for several months, as yields come down in 9 +/-3 month corrections to relieve their 18 month, 5-wave rallies. Tbond prices have done just the opposite, so they’ll be rising for 9 +/-3 months to correct their 18 month slide. DSE’s greatest accomplishment of the past two years was preparing BOOMers for that bond price peak (yield low) and reversal. Then, the warning just a month ago NOT to be short bond prices anymore, as the largest price rise/yield decline of the past year and a half was about to begin.
The fourth chart is the weekly bar chart of the 10-year T-note yields, showing the 18 month decline into the July ’12 low, and the 18 month doubling in yields since. Chart four shows the price version, using the Tbonds, zoomed in to show the end of that initial decline in December, and the rise since, which is likely only wave ‘a’ up. 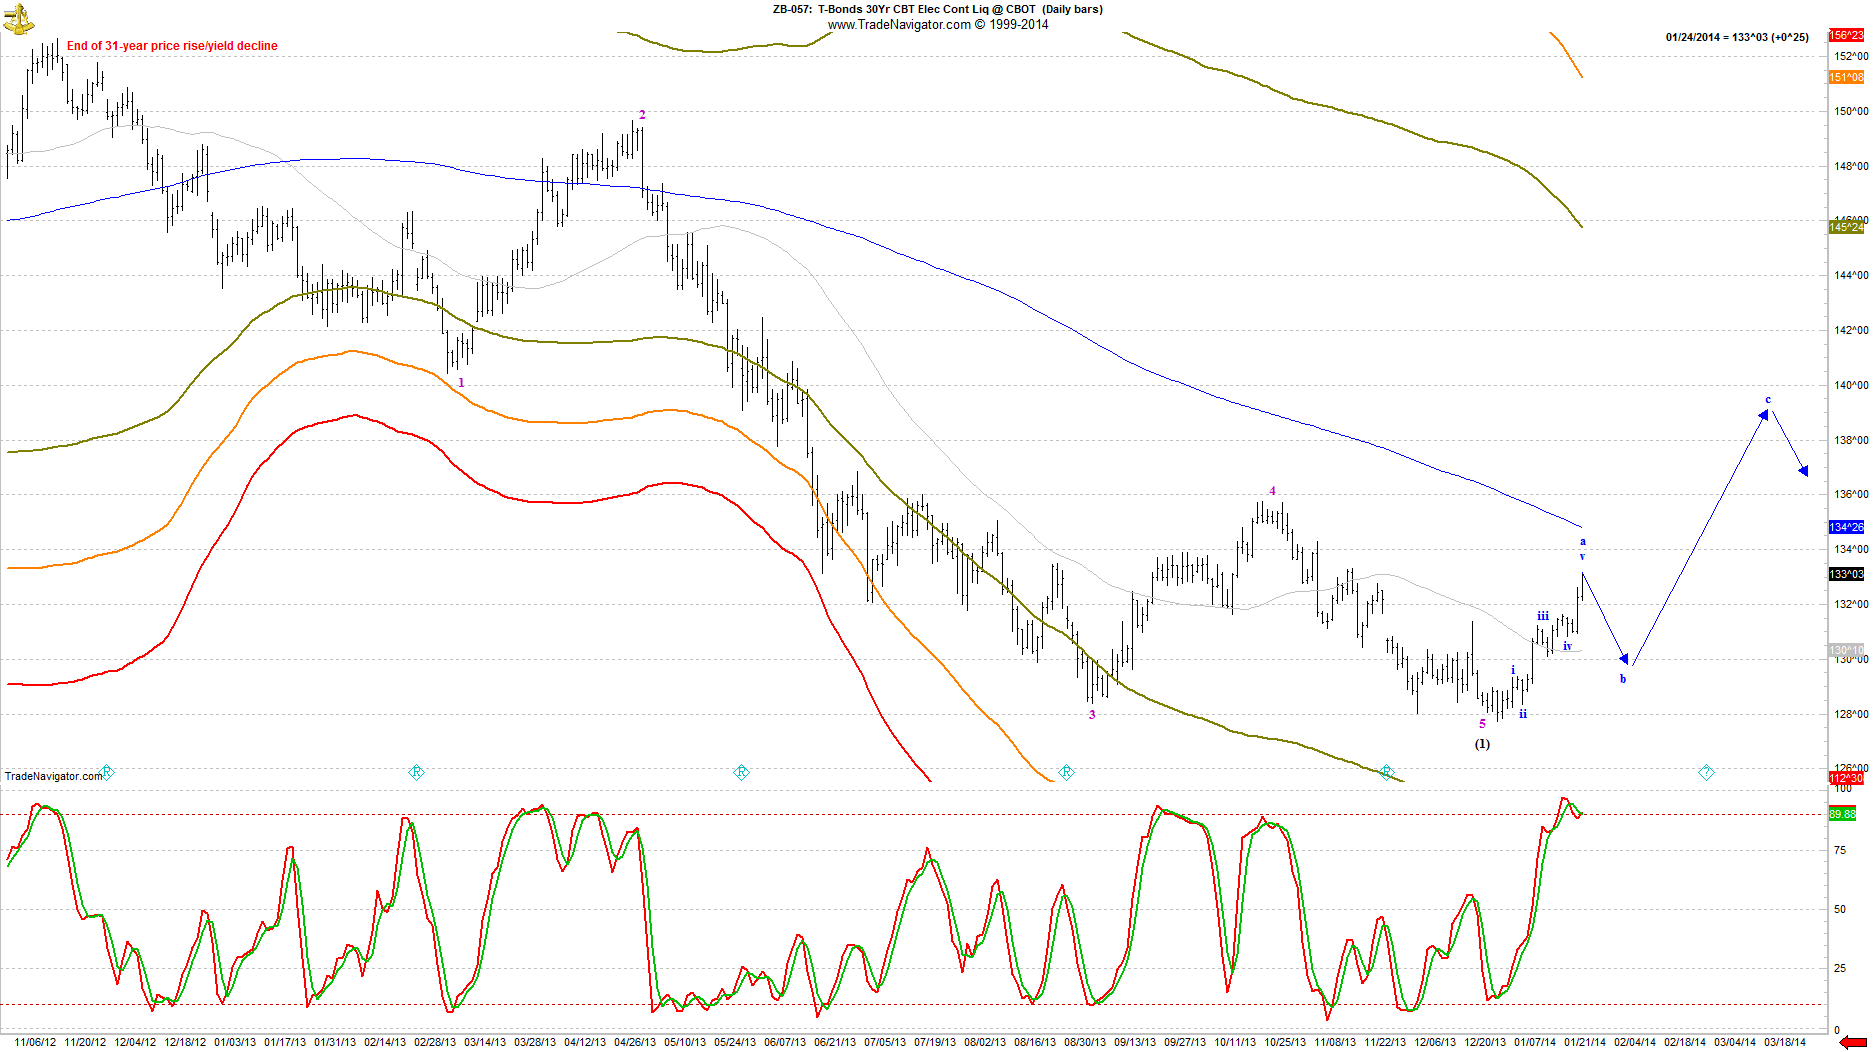
What is extraordinary is the herd’s certainty that ONLY a 3-5% decline is possible, despite the abundance of HISTORIC EXTREMES that have come to the surface in the past two years, leaving stocks as the only asset class that hasn’t rolled over yet. Real estate peaked in ’06, crude peaked in ’08, metals peaked in ’11, “safe” Treasuries peaked in ’12, and skyscrapers in “technical” echo in late ’13.
With the megaphone pattern satisfied to within 1.5%, as I showed last week, when the Dow closed just under the 16,864 ideal bullseye, a Hindenburg Omen Crash warning “on the clock” for several more months, and nowhere for Vix to go but up, the Spx and Ndx charts above MUST be given wide leeway for the reversals they MAY represent.
The last chart if of the NDX monthly bar, showing the picture I’ve tracked since ’99. It’s actually more shocking than most herd members can conceive, as most of the companies within it will be out of business, or at least de-listed, by that bottom, three years out from here, at which time most junk bonds will have defaulted. In fact, the recent rumblings in Puerto Rico suggest even the “full faith and credit” of the US will be challenged sooner than later. 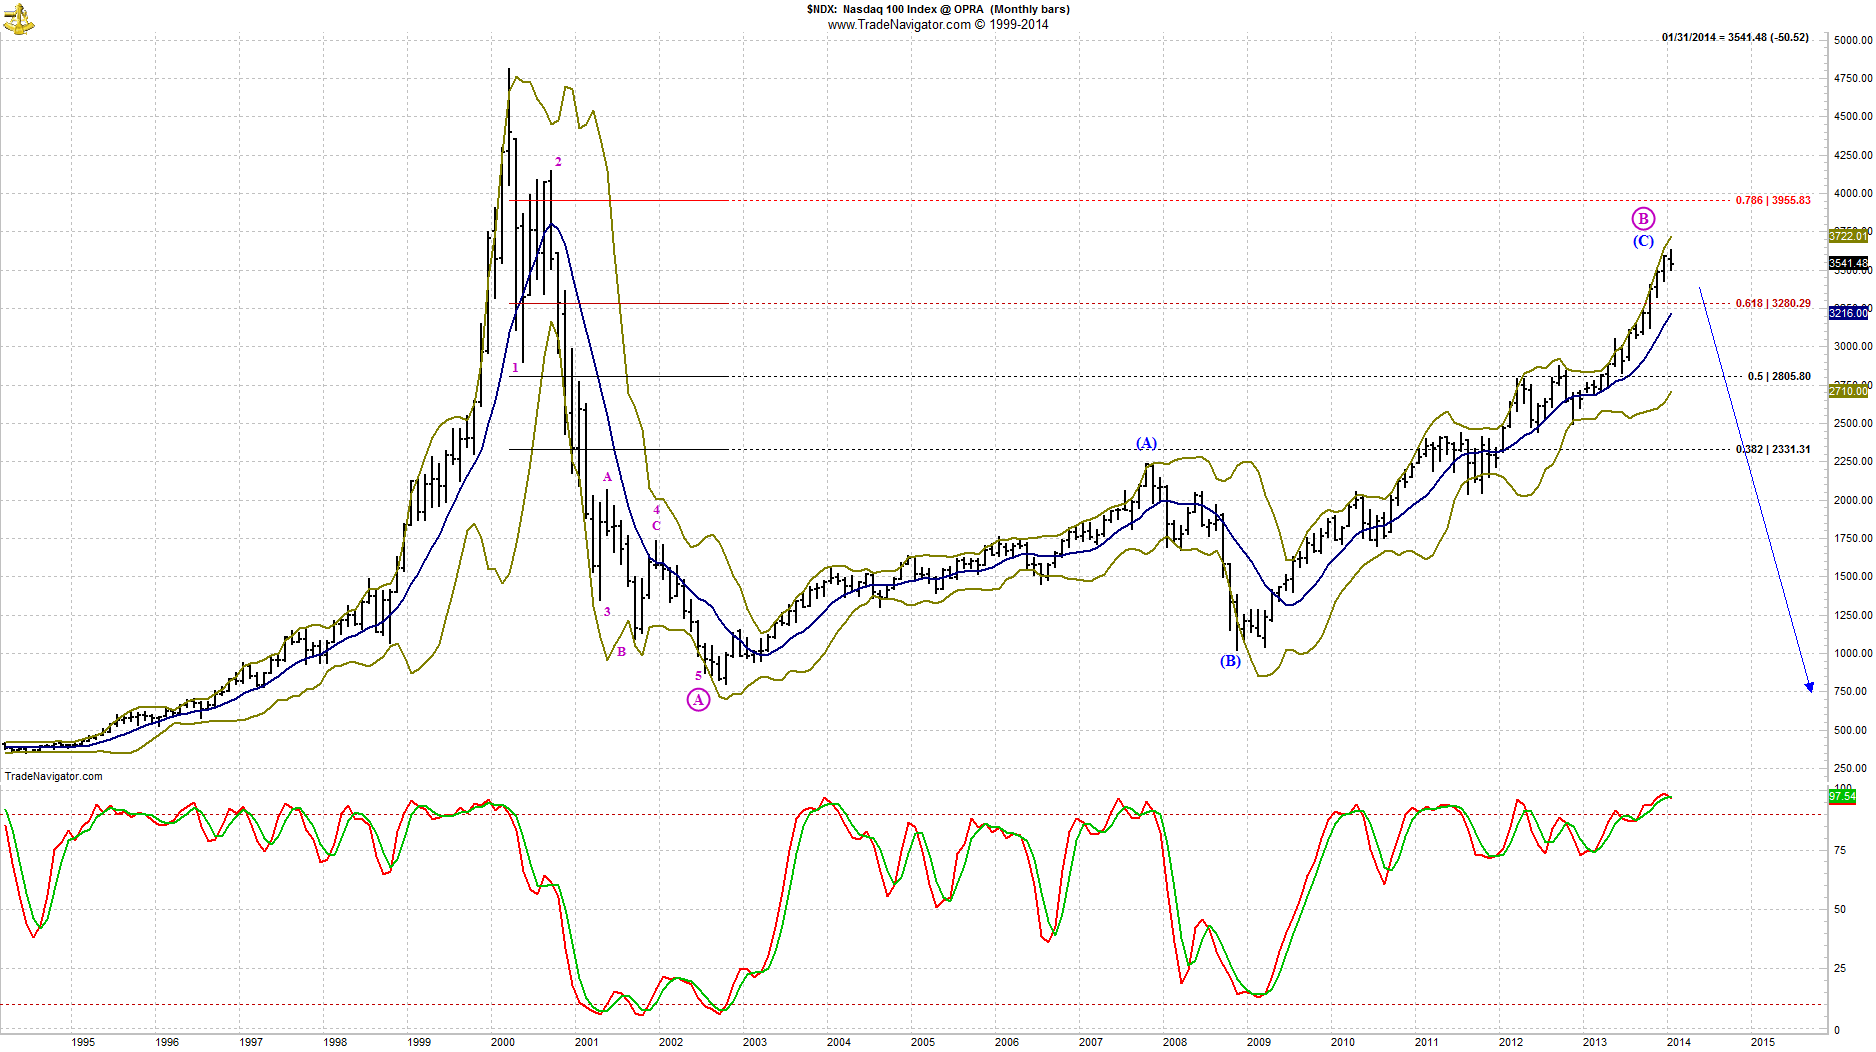
As we’ve shown, leverage, junk bond issuance, derivative exposure, covenant-lite loans, and every other manifestation of each of the past peaks of the past (Fibonacci) 13 years are all recurring or extending…ALL AT THE SAME TIME HERE/NOW! This makes the bet of this century to be short now against the various highs of the past month as your stop loss level. This is why we moved to 200% short last month, and are now in the money on that rung, and approaching breakeven on the second highest. By the time this selling reaches termination, around mid 2016 +/-1 year, all of that ladder will be dramatically profitable. To focus in on what maybe starting, rather than what mistakes of the past couple years, mostly in leveraged ETF’s and options (not our core competency, but tried to be all things to all BOOMers), we exited all positions, except what you see remaining, taking losses across the board. Going forward, we’ll stick to our guns – analysis, and trade much less, while going deeper into each forecast.
Arrogance (recent success + delusions of grandeur) clearly applies to us as well as those we analyze, making the past few years the most painful in my 30-year career. However, as I said in ’10, ’11, ’12, and ’13, my goal was to conserve capital for the “generational buying opportunity” that awaits the hard landing forecast for ’16 +/-1 year. My play was to keep 80% of capital in safe T-bills, while using the other 20% to try to increase net worth; but never risking the other 80%. While half of my trading 20% is gone, the remaining should be more than enough to return to full capital levels by that hard landing zone, and likely to be well above my ’09 basis.
New Fed Chairman Yellen resides over her first FOMC meeting this Tues/Wed, so expect the volatility to expand further. If the initial wave down is over, the counter trend bounce could end into that Wednesday announcement of “taper/not to taper”. If there is still another up/down, or even two more, a multi-day low should arrive by then.
