In my last review of the housing market, I ran out of time to comment on an emphatic statement from the National Association of Home Builders (NAHB) regarding its failure to influence the Republican plan for tax reform. The tax plan coming out of the GOP side of the House of Representatives includes a provision to cut in half the cap on mortgages eligible for the interest rate deduction and also caps the deduction for state and local property taxes at $10,000. At the same time, the standard deduction is doubled so the number of people who will itemize should significantly drop. The NAHB has serious concerns about the potential negative impact on home ownership, and it delivered a clear warning that turned into a precursor of the steep sell-off in housing related stocks. From NAHB Chairman Granger MacDonald on the GOP tax plan:
“This plan is particularly disappointing, given that the nation’s home builders warned that the proposal would severely diminish the effectiveness of the mortgage interest deduction and presented alternative policies that would retain an effective housing tax incentive in the tax code…
By sharply reducing the number of taxpayers who would itemize, what’s left is a tax bill that essentially eviscerates the mortgage interest deduction and strips the tax code of its most vital homeownership tax benefit. This tax blueprint will harm home values, act as a tax on existing home owners and force many younger, aspiring home buyers out of the market.”
While the responses in the stock market varied roughly according to the concentration of high-end and expensive housing for a given home builder, the net impact on iShares US Home Construction ETF (NYSE:ITB) and SPDR S&P Homebuilders ETF (NYSE:XHB), which includes Home Depot (NYSE:HD) and Lowe’s (NYSE:LOW), was immediate and steep. ITB lost 2.4% and XHB lost 2.8%. LOW dropped 4.1%, and HD dropped 1.6%.
I cannot explain why the two home improvement stores had such different impacts (I believe they have similar national coverage?), but the selling is likely from the theory that home sales will drop as richer home owners will be more reluctant to move in the face of dramatically worse tax situations; current homeowners are grandfathered into the existing tax scheme. I provide select charts at the end of this post along with brief commentary.
While I complained in my last Housing Market Review that I was likely to miss the coming cycle of seasonal strength in home builders, I resisted the temptation to buy into the selling. Indeed, some of the charts below look like the beginnings of falling knives. I stopped out of my last position in a home builder as TRI Pointe Homes Inc (NYSE:TPH) sold off most of the day. Luxury home builder Toll Brothers Inc (NYSE:TOL) was particularly tempting given a loss that was as high as 7% at one point. KeyBanc even stepped up as one of the first analysts to suggest buying into the sell-off by recommending TOL. Yet, seeing TOL’s CEO warn about the negative impact of this tax plan was the final stay for my hand. He specifically claimed that reducing the cap on the mortgage interest deduction would be very bad policy, and he toed the industry line.
There was at least ONE positive in all the chaos: Invitation Homes Inc (NYSE:INVH) gained on the day. Presumably, fewer new home buyers means more renters and thus more business for companies like INVH which manages homes for rent.
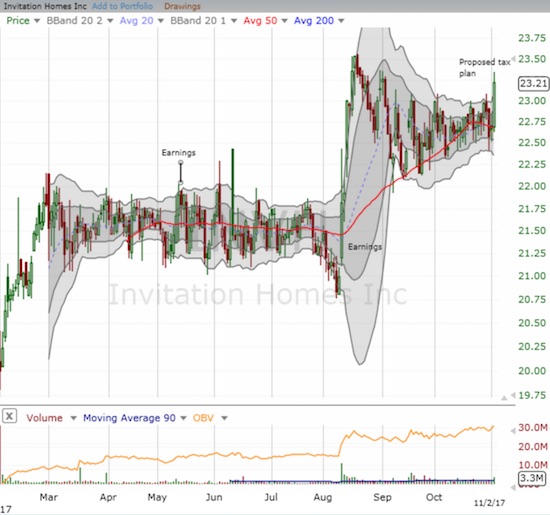
Invitation Homes (INVH) came back to life with a 2.5% gain that looks like a fresh breakout.
Here are the rest of my select charts showing the carnage on the day…
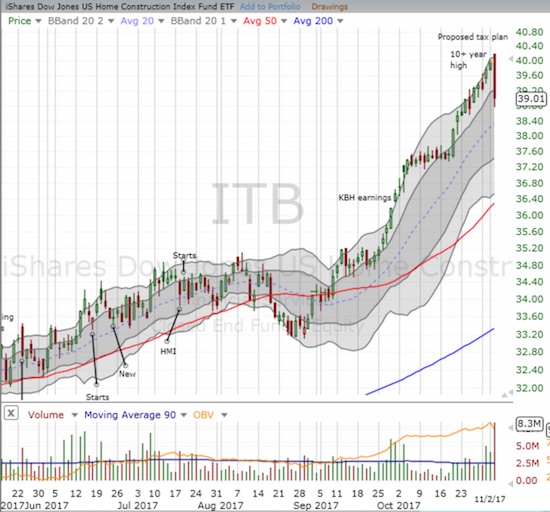
The iShares US Home Construction ETF (ITB) tumbled off its 10-year high for a 2.4% loss on the day.
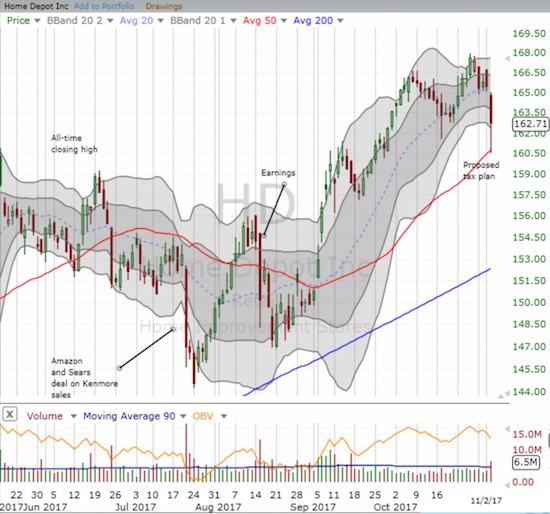
Home Depot (HD) bounced neatly off its uptrending 50DMA.
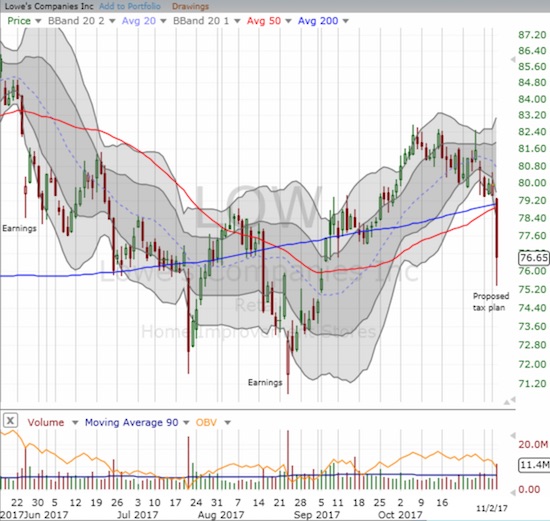
Lowe’s (LOW) experienced a bearish breakdown from converged 50 and 200DMA support.
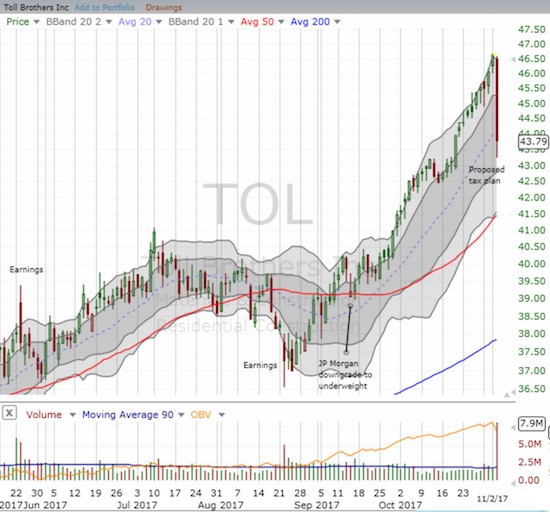
Toll Brothers (TOL) ended a relentless uptrend through its upper-Bollinger Band (BB) with a 6.1% loss.
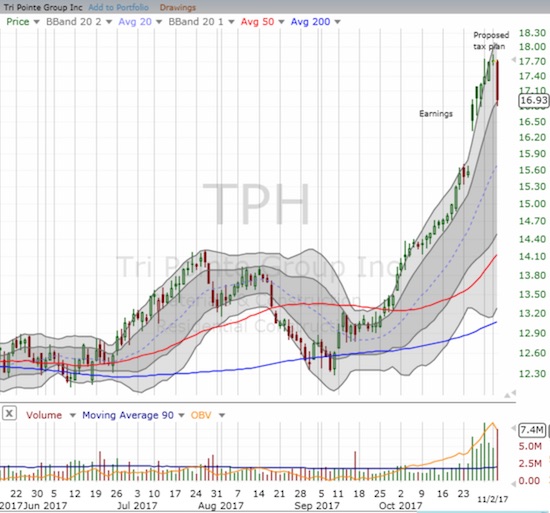
California-heavy Tri Pointe Group (TPH) plunged 4.4% but managed to stay within its upper-Bollinger Band uptrend.
So much for considering buying California-focused Five Point Holdings LLC (NYSE:FPH) as a “cheap” housing play for the coming season. The severe reaction to the tax plan suggests I can afford to continue being patient.
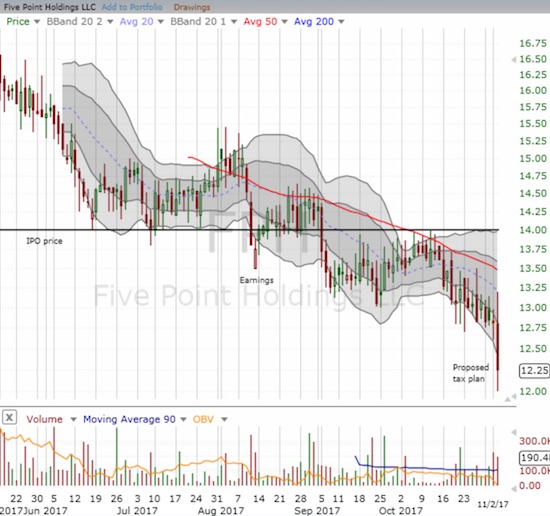
Five Point Homes (FPH) took a while to get moving. When it did, the stock delivered a 4.4% loss on the day.
I do not regularly follow William Lyon Hms (NYSE:WLH), but I have added it to my list based on the near parabolic reaction to earnings just three days ago.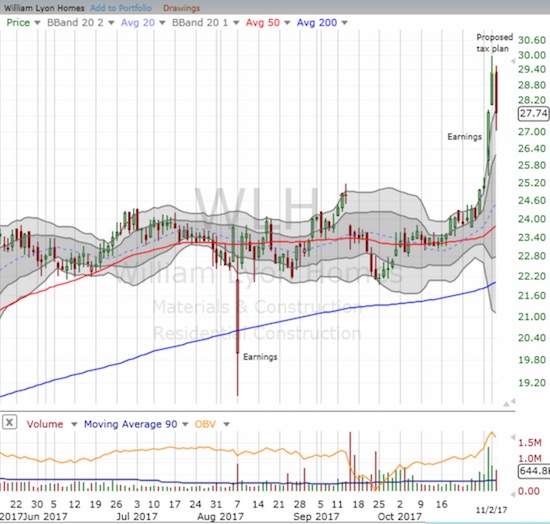
Even with a 5.3% sell-off, William Lyon Homes (WLH) managed to close on TOP of its upper-Bollinger Band (BB).
MDC Holdings Inc (NYSE:MDC) had the misfortune of reporting poorly received earnings on the same day as the announcement of the tax plan. The result was the most disastrous loss of the day: 12.0%.
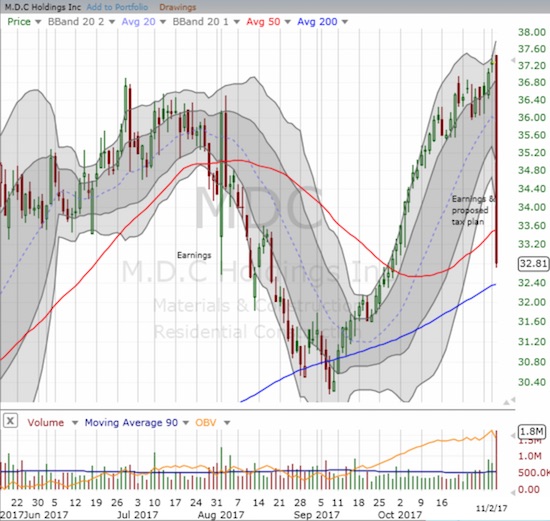
M.D.C Holdings (MDC) broke down below its 50DMA support. If the 200DMA uptrend holds, MDC could become an attractive buy-the-dip play.
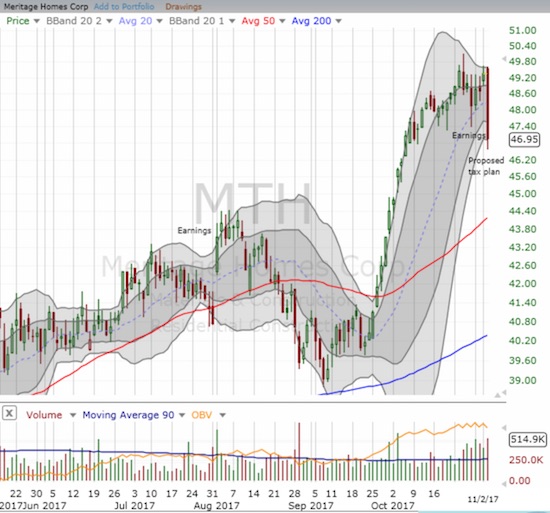
Meritage Corporation (NYSE:MTH) suddenly looks very toppy with its 4.9% loss on the day.
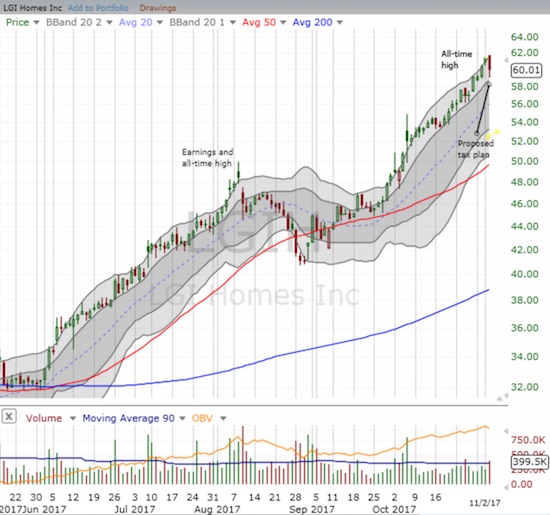
LGI Homes (NASDAQ:LGIH) lost 2.2% but stayed within its impressive uptrending channel.
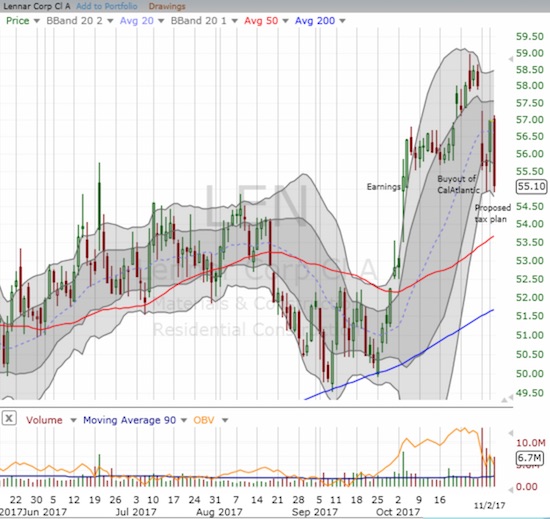
Lennar (NYSE:LEN), already licking its wounds from its announced deal for CalAtlantic, lost 3.3% to close at a new post-earnings low.
While Lennar (LEN) lost a substantial amount on the day, diversification should ultimately lower the impact on business for the largest home builders. DR Horton Inc (NYSE:DHI) looks like the winner on this score as the stock nearly escaped the day’s sector selling unscathed….
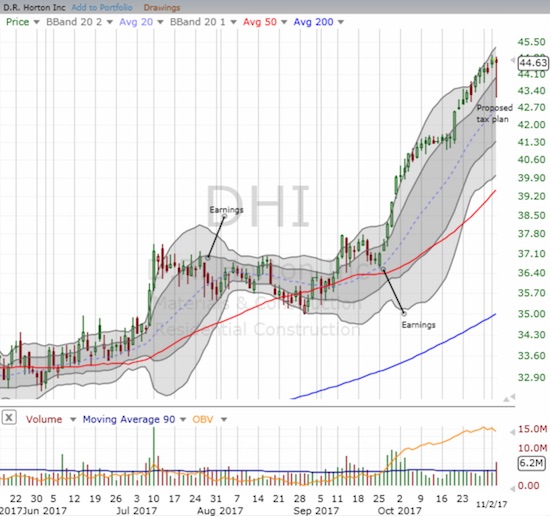
D.R. Horton, Inc. (DHI) rallied off its low of the day to close near flat
PulteGroup Inc (NYSE:PHM) bounced back as well but still ended the day with a 1.1% loss.
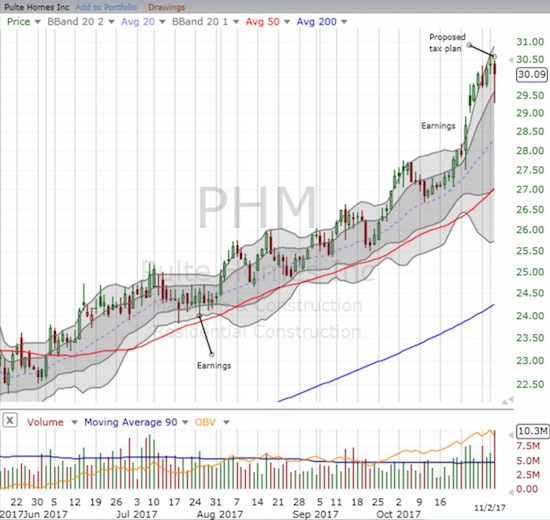
PulteHome (PHM) held onto its primary uptrend.
As long as the turmoil in the sector remains active, I am likely to increase the frequency of my postings on the housing market. Stay tuned and…
…Be careful out there!
Full disclosure: long INVH
