HollyFrontier Corporation (NYSE:HFC) is an independent petroleum refiner with a market cap of roughly $8.8 billion. The stock reached an all-time high of $83.28 a share in June 2018. By late-May 2019, it was barely able to hold above $37, losing nearly 55% in just one year.
However, HFC recovered significantly in the last four months. The stock closed at $53.34 yesterday, up by over 41% since the beginning of June. Is this the beginning of a larger uptrend or just a corrective rally within the larger selloff? Let’s examine the chart below from an Elliott Wave perspective and see what we’ll find.

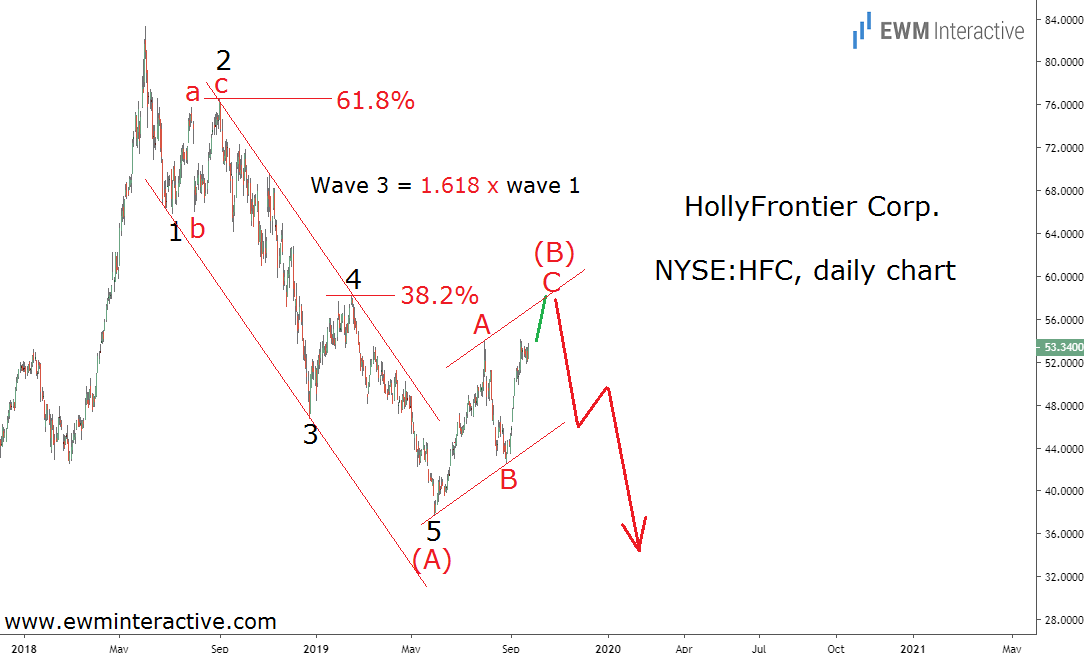
The daily chart of HollyFrontier reveals that the decline from over $83 to under $38 formed a five-wave impulse pattern. It is labeled 1-2-3-4-5 and shows several Fibonacci relationships between the waves. Wave 2 retraced 61.8% of wave 1, wave 3 is 1.618 times longer than wave 1 and wave 4 retraced 38.2% of wave 3.
A Double Resistance Awaits HollyFrontier Stock near $60
The theory states that a three-wave correction in the other direction follows every impulse before the trend resumes. That is exactly what we believe the recovery from $37.73 represents – a simple A-B-C zigzag retracement. While the impulse in wave (A) unfolded within a trend channel, wave (B) seems to be developing in a corrective channel.
This means HollyFrontier bulls are about to face a double resistance near $58 a share in wave C of (B). It is formed by the termination area of wave 4 of (A) and the upper line of the corrective channel. If this analysis is correct, we can expect more weakness in wave (C) once wave C of (B) completes the 5-3 wave cycle.
A bearish reversal can be expected between $55 and $60 a share. Then, wave (C) should be able to drag HollyFrontier to at least $30 a share. In other words, despite being down 36% since June 2018, HFC can still lose half its market value. Given how its results suffered in 2008 and 2009, this is hardly a company investors would like to own with another recession on the horizon.
