Our last update commented on a possible bottom in Soybeans based on a H&S bottom on the continuation graph (most active contract roll).
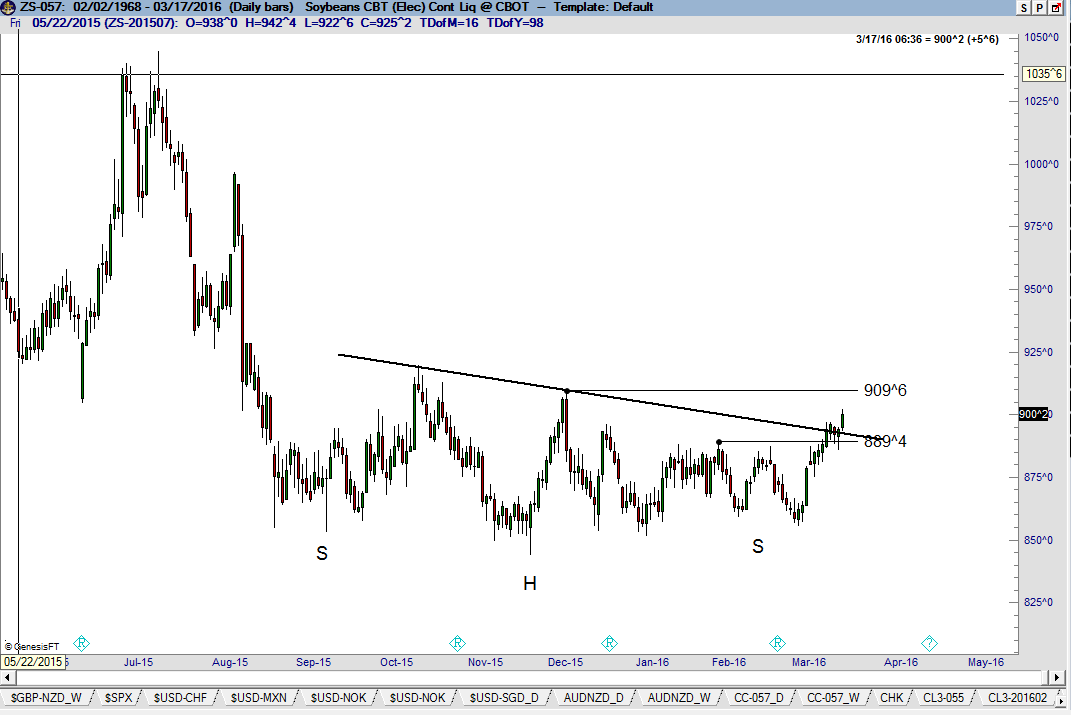
A close above 900 would, in my opinion, complete this bottom. It is unfortunate that the charts of the individual contract months do now show the precision of the continuation graph. This chart illustrates the reasons I far prefer a flat or horizontal neckline.
Even though the neckline as drawn may be violates the left and right, should highs remain those would be serious resistance points. Thus, even though the H&S pattern might be completed with a neckline breakout, the market remains in a trading range.
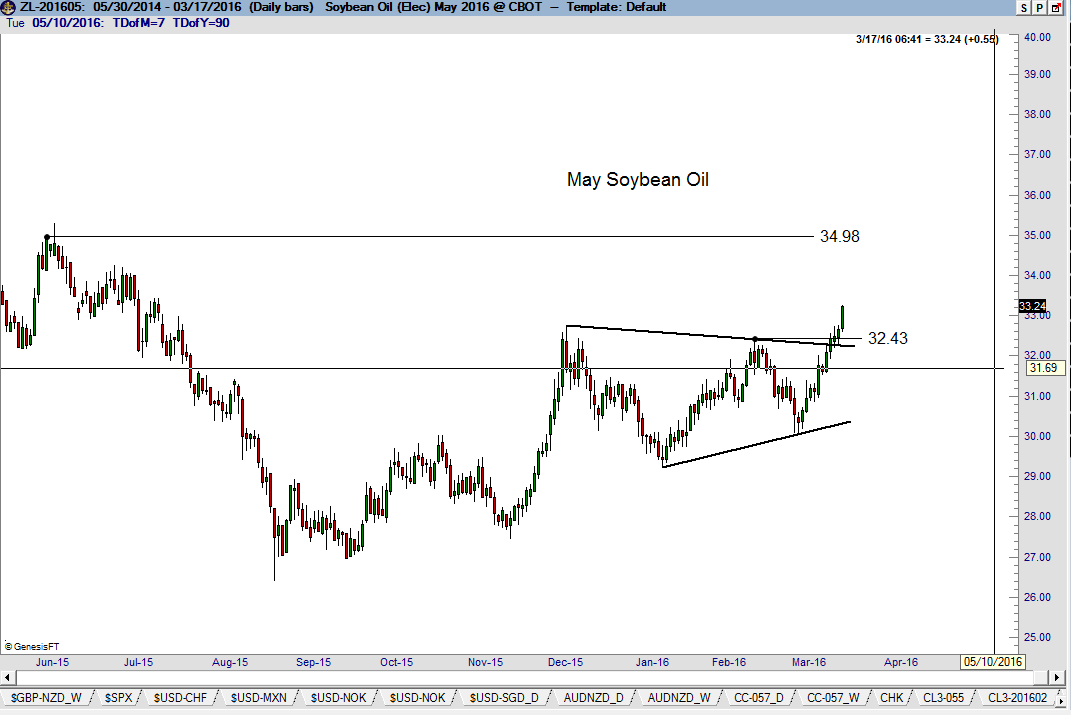
Soybean Oil has completed its symmetrical triangle and looks poised to challenge 35 cents.
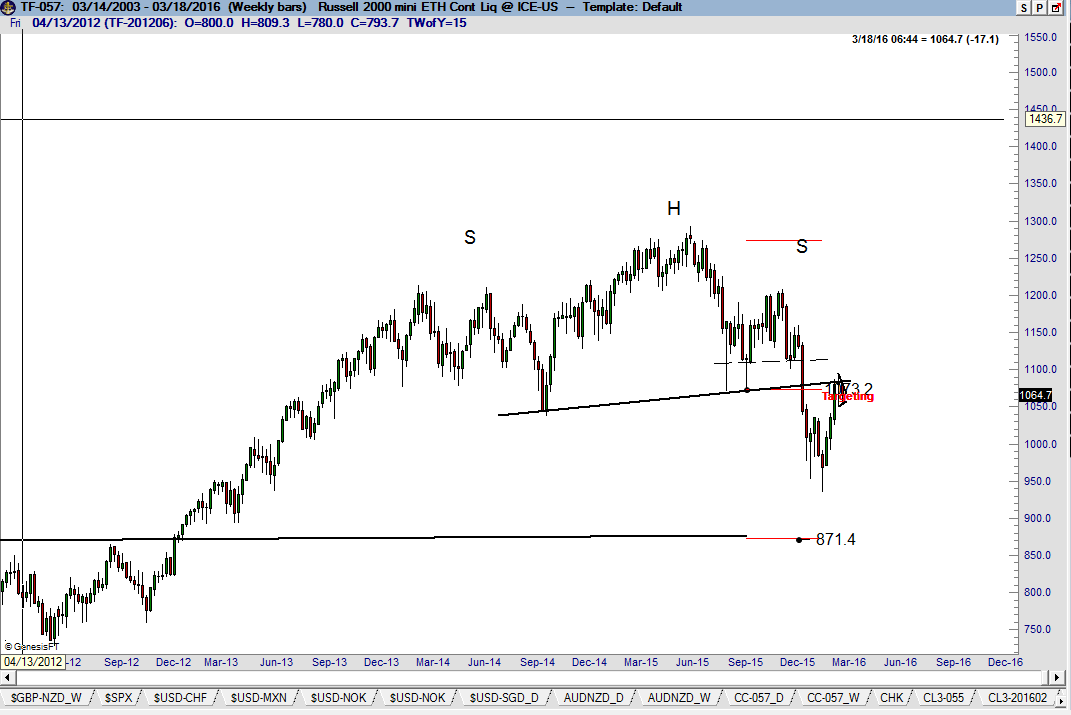
My trading philosophy is that when long, one should be long the strongest member of a correlated group of markets — and when short, one should be short the weakest member of a correlated group of markets. The Russell 2000 has been the weakest of the major U.S. stock index markets and is, therefore, my candidate for a short position.
The Russell is testing the underbelly of the neckline of a completed H&S top on the weekly graph as shown below.
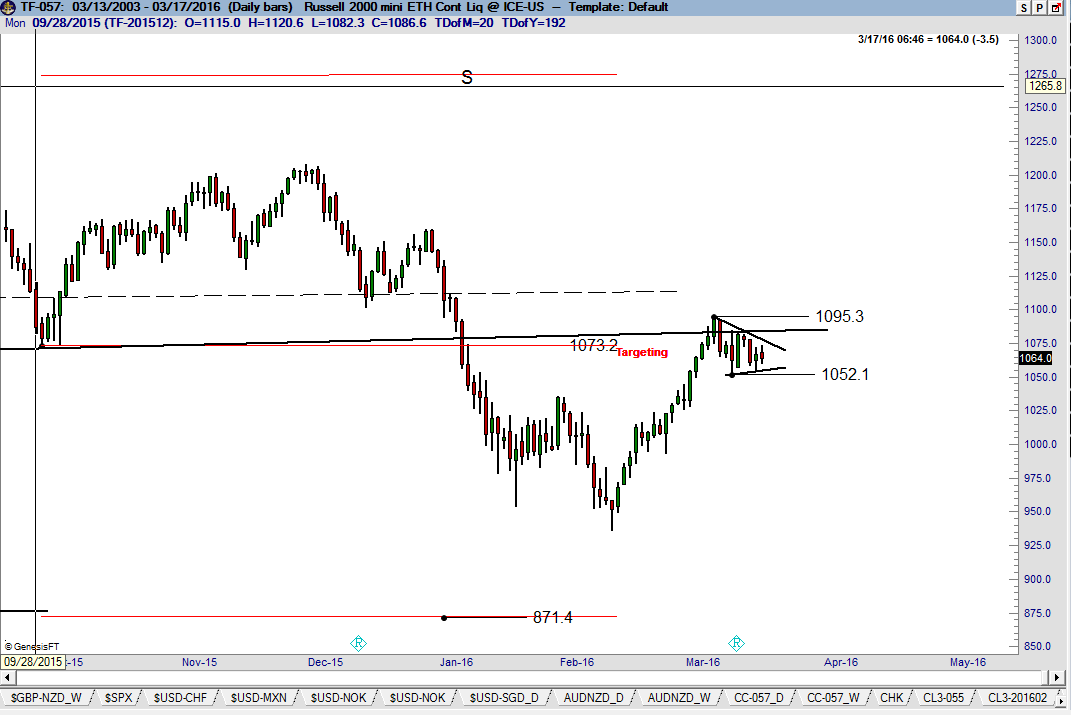
I want to be alert for a shorting opportunity in the Russell. The daily graph might be forming a very small symmetrical triangle top. Keep in mind that shorter-term patterns tend to morph. I am watching the present trading range in the Russell of 1052 to 1095 for a clue on a trading opportunity.
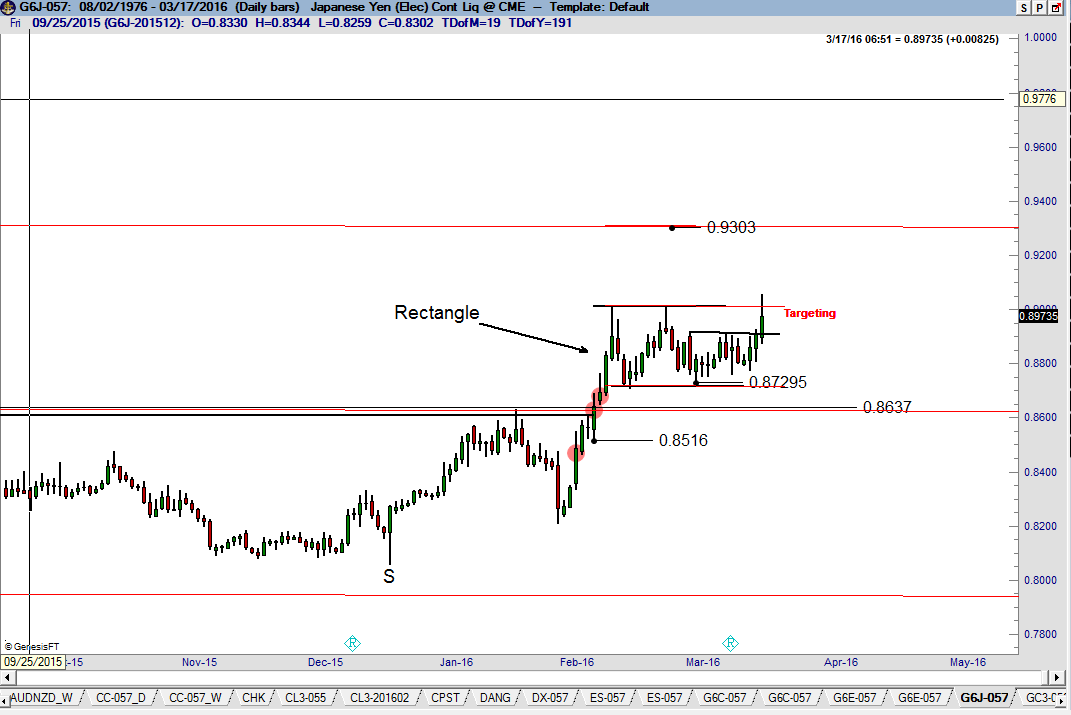
The advance Friday in the yen is attempting to complete the upper boundary of a 5-week rectangle. I am not sure this chart is ready to thrust higher, although my bullish bias remains fully intact — with a target at 9300. Unless the market reverses, the highest close of the move could be posted. Factor maintains a sizable long position in yen futures.
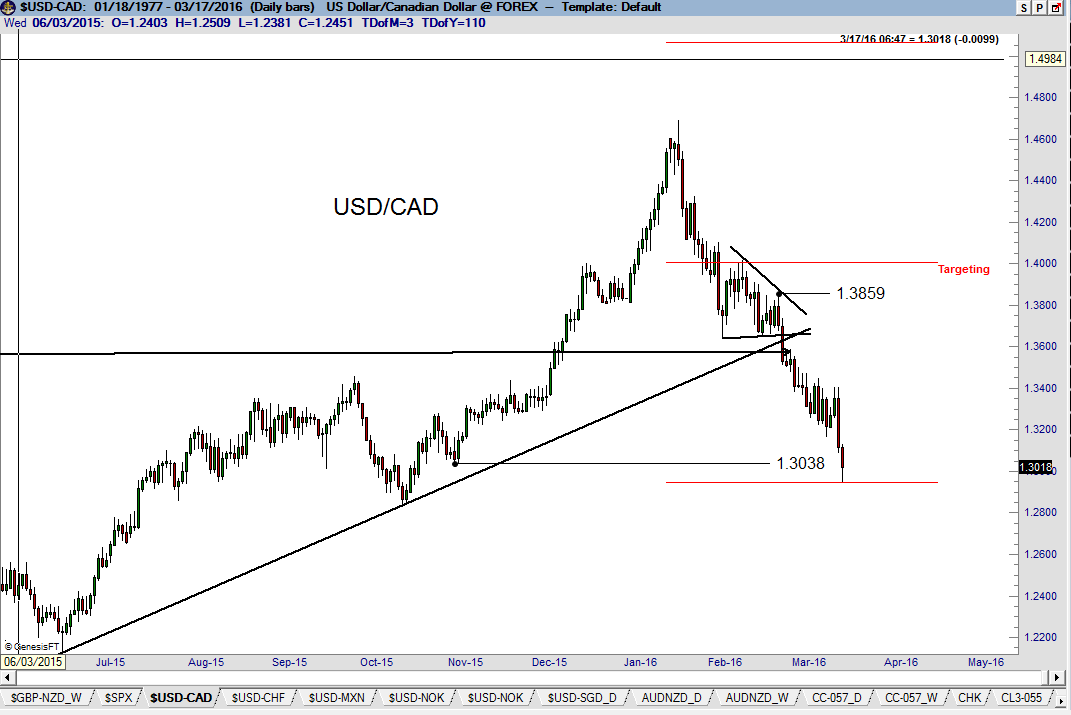
The target in the spot USD/CAD was met on Friday.
Note: We are in treacherous markets. Careless over-trading or excessive leverage can do great damage in a volatile trading environment.
