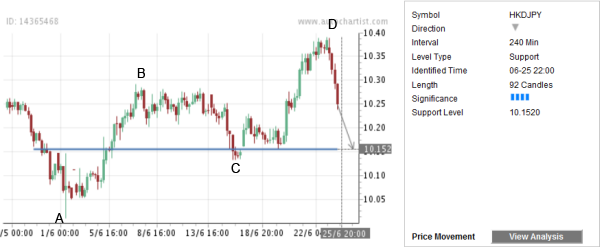
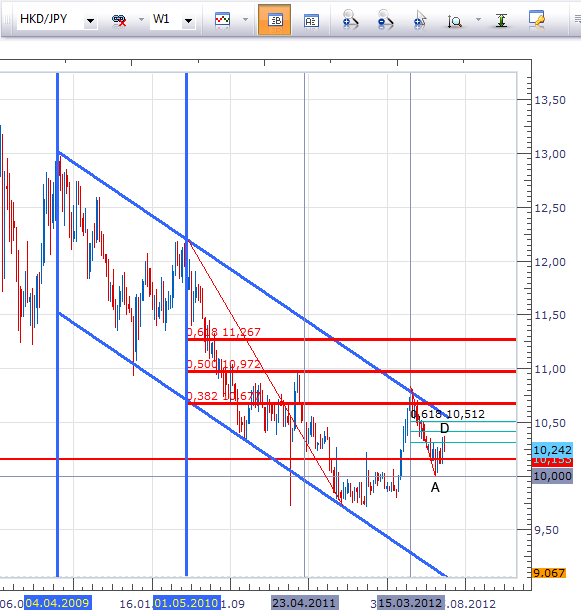
We have recently identified the horizontal Key Support Level 10.1520 (Type Approach) on the 4-hour HKD/JPY charts. The Significance of this Support level is measured at the 4 bar level which corresponds to the 4 recent price reversals from 10.1520. Points A and D on the Key Level chart below enclose the well-formed daily ABC correction to the preceding sharp daily downward price thrust from the strong resistance area lying at the intersection of the longer-term weekly downward price channel resistance trendline from the April of 2009 as well as the 38,2% Fibonacci Retracement of the preceding weekly sharp downward price impulse from the May of 2010 (as is shown on the second chart below). Point D was formed at the 38,2% Fibonacci Retracement of the latest daily downward price impulse from the aforementioned resistance area. The pair is expected to fall further to the Key Support 10.1520 in the nearest time.
The following weekly HKD/JPY chart shows the longer-term picture of this currency pair’s movement: HKD/JPY" title="HKD/JPY" width="581" height="610">
- English (UK)
- English (India)
- English (Canada)
- English (Australia)
- English (South Africa)
- English (Philippines)
- English (Nigeria)
- Deutsch
- Español (España)
- Español (México)
- Français
- Italiano
- Nederlands
- Português (Portugal)
- Polski
- Português (Brasil)
- Русский
- Türkçe
- العربية
- Ελληνικά
- Svenska
- Suomi
- עברית
- 日本語
- 한국어
- 简体中文
- 繁體中文
- Bahasa Indonesia
- Bahasa Melayu
- ไทย
- Tiếng Việt
- हिंदी
HKD/JPY At Key Support Level 10.1520
Published 06/26/2012, 04:01 AM
Updated 03/09/2019, 08:30 AM
HKD/JPY At Key Support Level 10.1520
Latest comments
Loading next article…
Install Our App
Risk Disclosure: Trading in financial instruments and/or cryptocurrencies involves high risks including the risk of losing some, or all, of your investment amount, and may not be suitable for all investors. Prices of cryptocurrencies are extremely volatile and may be affected by external factors such as financial, regulatory or political events. Trading on margin increases the financial risks.
Before deciding to trade in financial instrument or cryptocurrencies you should be fully informed of the risks and costs associated with trading the financial markets, carefully consider your investment objectives, level of experience, and risk appetite, and seek professional advice where needed.
Fusion Media would like to remind you that the data contained in this website is not necessarily real-time nor accurate. The data and prices on the website are not necessarily provided by any market or exchange, but may be provided by market makers, and so prices may not be accurate and may differ from the actual price at any given market, meaning prices are indicative and not appropriate for trading purposes. Fusion Media and any provider of the data contained in this website will not accept liability for any loss or damage as a result of your trading, or your reliance on the information contained within this website.
It is prohibited to use, store, reproduce, display, modify, transmit or distribute the data contained in this website without the explicit prior written permission of Fusion Media and/or the data provider. All intellectual property rights are reserved by the providers and/or the exchange providing the data contained in this website.
Fusion Media may be compensated by the advertisers that appear on the website, based on your interaction with the advertisements or advertisers.
© 2007-2025 - Fusion Media Limited. All Rights Reserved.
