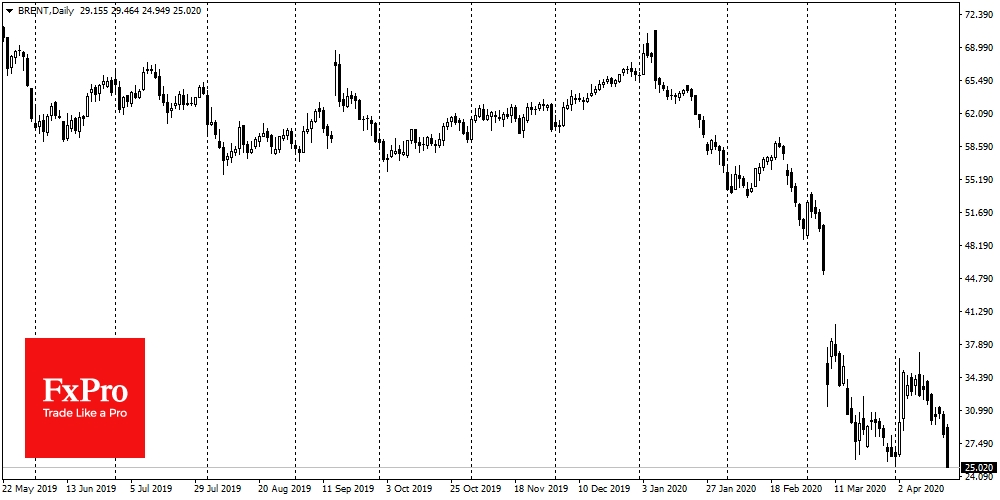
Prices for WTI futures with May delivery in the US declined to -$40, as under these supply contracts oil had no place to be stored, and trading under these contracts ends today. It often happens that the expiring contracts are sold out before the expiration, as traders roll on to the next contract. But this historic collapse of prices has increased the degree of anxiety in the markets. On Tuesday morning, oil prices continued their decline. Brent spot price declined below $25, returning dangerously close to the month’s low.
Although cheap oil is both a symptom of the problems in the economy and one of the ways of its recovery, the decline in prices still pushes down stock indices. Investors now consider oil as an indicator of financial markets condition. And so far, the conclusion is that the world is not yet on a firm basis for recovery.
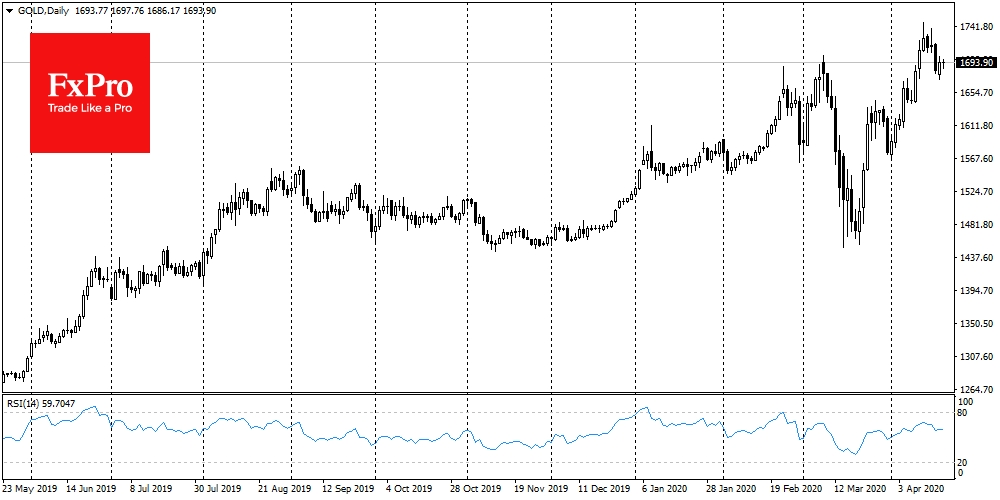
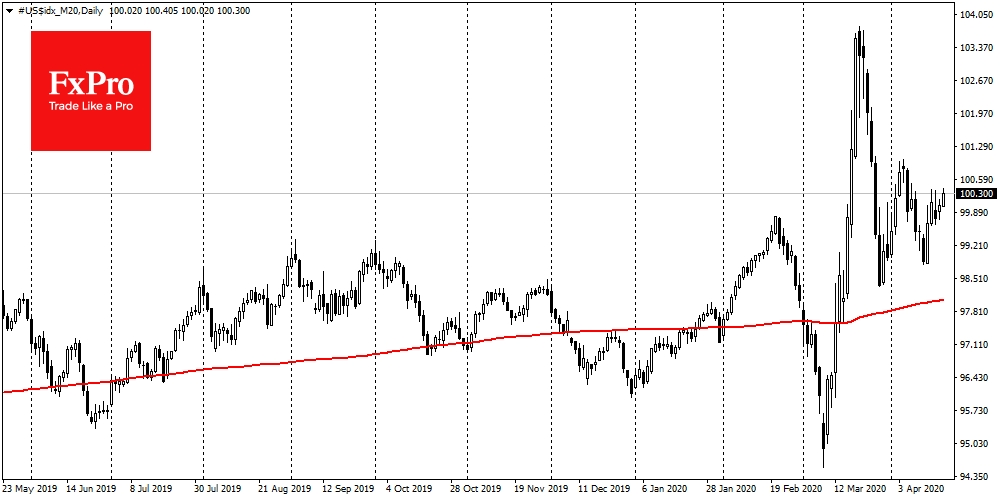
We saw that the recovery of stock markets last week was stalled at the signs of a steady decline in oil prices. But it is even worse than gold prices are also rolling back from highs, and the dollar index is moving up. This combination of market reactions was observed in mid-March, amid extreme collapses. It is explained by the lack of liquidity in the markets when the value of cash is growing many times everywhere, as they can both pay off debts and buy goods and services.
Previously, it was believed that the Japanese yen beat the dollar during such periods of widespread deleveraging. However, in the second decade of March – when there were historically extreme market movements – demand for the dollar exceeded everything else. If we see a new phase of this movement, we should not focus on the yen as an indicator of security demand. The dollar may immediately become a market leader, while oil and gold will be under short-term but intense pressure.
The FxPro Analyst Team
- English (UK)
- English (India)
- English (Canada)
- English (Australia)
- English (South Africa)
- English (Philippines)
- English (Nigeria)
- Deutsch
- Español (España)
- Español (México)
- Français
- Italiano
- Nederlands
- Português (Portugal)
- Polski
- Português (Brasil)
- Русский
- Türkçe
- العربية
- Ελληνικά
- Svenska
- Suomi
- עברית
- 日本語
- 한국어
- 简体中文
- 繁體中文
- Bahasa Indonesia
- Bahasa Melayu
- ไทย
- Tiếng Việt
- हिंदी
Historical Crude Oil Collapse Boosts Anxiety In Markets
Published 04/21/2020, 07:21 AM
Historical Crude Oil Collapse Boosts Anxiety In Markets
Latest comments
Loading next article…
Install Our App
Risk Disclosure: Trading in financial instruments and/or cryptocurrencies involves high risks including the risk of losing some, or all, of your investment amount, and may not be suitable for all investors. Prices of cryptocurrencies are extremely volatile and may be affected by external factors such as financial, regulatory or political events. Trading on margin increases the financial risks.
Before deciding to trade in financial instrument or cryptocurrencies you should be fully informed of the risks and costs associated with trading the financial markets, carefully consider your investment objectives, level of experience, and risk appetite, and seek professional advice where needed.
Fusion Media would like to remind you that the data contained in this website is not necessarily real-time nor accurate. The data and prices on the website are not necessarily provided by any market or exchange, but may be provided by market makers, and so prices may not be accurate and may differ from the actual price at any given market, meaning prices are indicative and not appropriate for trading purposes. Fusion Media and any provider of the data contained in this website will not accept liability for any loss or damage as a result of your trading, or your reliance on the information contained within this website.
It is prohibited to use, store, reproduce, display, modify, transmit or distribute the data contained in this website without the explicit prior written permission of Fusion Media and/or the data provider. All intellectual property rights are reserved by the providers and/or the exchange providing the data contained in this website.
Fusion Media may be compensated by the advertisers that appear on the website, based on your interaction with the advertisements or advertisers.
© 2007-2025 - Fusion Media Limited. All Rights Reserved.
