🐂 Not all bull runs are created equal. November’s AI picks include 5 stocks up +20% eachUnlock Stocks

Hindenburg Omen Is Back, Means Nothing For US

Published 08/28/2017, 08:44 AM
Updated 07/09/2023, 06:31 AM

The Hindenburg Omen, a 'technical indicator based on Fosback's High Low Logic Index (HLLI), is flashing a warning signal again. The HLLI, a combination of technical factors that attempt to measure the health of the NYSE and stock market as a whole, is the lesser of the NYSE new highs or new lows divided by the number of NYSE issues traded. The HLLI defines balance within the market. A substantial number of stocks may set either new annual highs or new annual lows, but not both at the same time under normal market conditions. In other words, a healthy market possesses a degree of uniformity. Observation of simultaneous new highs and lows suggests growing imbalance and trouble. Trouble with the HLLI, something I have witnessed first hand, is that imbalance produces a lot of false signals. That is, a lot of Omens that do not materialize into crashes.

Whether it be the Hindenburg Omen, overvaluation of fundamentals, or some other technical evidence, the bears, seizing weakness during cause building, are embracing anything that supports their opinion.

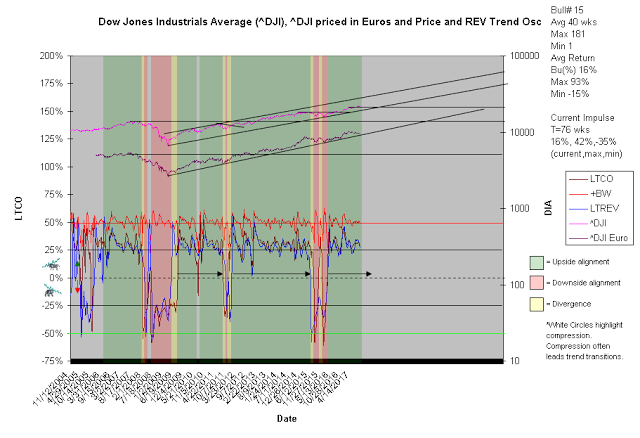
The message of the market for US stock since 1999 is as follows (chart1):

1. 15 weekly aligned up impulses.
2. Time (avg, max, min): 40 wks, 181, 1.
3. Average annualized return profile (impulse, max, min): 16%, 93%, -15 %.
4. Current impulse: 76 wks, 15%, 42%, -35% (current, max, min).

Trading Notes tracks these trends in detail.

Dow Jones Industrials Average

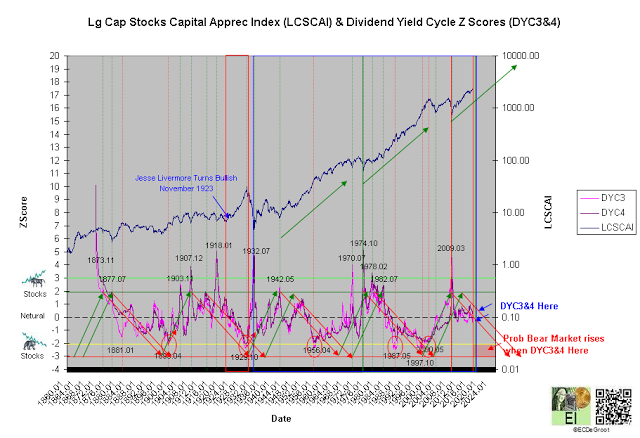
Is the market overvalued? Highly concentrated and ready to crash? Dividend cycle concentrations say no (chart2). Dividend Yield Cycles provide further discussion of this topic.

Lg Cap Stock Capital Apprec Index

Headline: Bad news for the stock market: The Hindenburg Omen is back

The dreaded Hindenburg Omen is back.

Named for the German airship that met its demise in a fiery explosion 80 years ago, the appearance of this technical pattern sometimes portends a stock-market crash.

Latest comments

Loading next article…
Risk Disclosure: Trading in financial instruments and/or cryptocurrencies involves high risks including the risk of losing some, or all, of your investment amount, and may not be suitable for all investors. Prices of cryptocurrencies are extremely volatile and may be affected by external factors such as financial, regulatory or political events. Trading on margin increases the financial risks.
Before deciding to trade in financial instrument or cryptocurrencies you should be fully informed of the risks and costs associated with trading the financial markets, carefully consider your investment objectives, level of experience, and risk appetite, and seek professional advice where needed.
Fusion Media would like to remind you that the data contained in this website is not necessarily real-time nor accurate. The data and prices on the website are not necessarily provided by any market or exchange, but may be provided by market makers, and so prices may not be accurate and may differ from the actual price at any given market, meaning prices are indicative and not appropriate for trading purposes. Fusion Media and any provider of the data contained in this website will not accept liability for any loss or damage as a result of your trading, or your reliance on the information contained within this website.
It is prohibited to use, store, reproduce, display, modify, transmit or distribute the data contained in this website without the explicit prior written permission of Fusion Media and/or the data provider. All intellectual property rights are reserved by the providers and/or the exchange providing the data contained in this website.
Fusion Media may be compensated by the advertisers that appear on the website, based on your interaction with the advertisements or advertisers.
© 2007-2024 - Fusion Media Limited. All Rights Reserved.