Once per month I update a high yield dividend stock momentum portfolio on Scott’s Investments. The portfolio is comprised of the highest yielding stocks in the S&P 500 with high price momentum.
The portfolio is a simple quantitative strategy and begins by screening the S&P 500 for stocks yielding greater than 4%. The results are then ranked by their 6 month returns. The top stocks are then added to a hypothetical portfolio and tracked publicly on Scott’s Investments. This month there were 53 results, four more than last month.
Per a previous article, the highest momentum, high-yield stocks have historically out-performed lower yielding, lower momentum stocks. The screen is more of a trading strategy and less of a passive income strategy, although the dividends do play an essential component in the overall returns. Thus, turnover could be high and the strategy is not for everyone but I have added one modification to the strategy to minimize turnover.
In order to limit turnover stocks with yields that have fallen below 4% due to share price appreciation will remain in the portfolio. Stocks will only be sold when yield falls below 4% due to dividend cuts or when the six-month performance would otherwise lag the top 12 stocks in the screen.
The portfolio has turnover in four positions for September. DTE Energy (DTE), PG&E Corp (PCG), Reynolds American (RAI), and Federated Investors (FII) are all being sold. DTE lost 1.23% in its one month stint in the portfolio, PCG lost 3.57% in its 3 months as a holding, RAI lost 2.84% in 2 months, and FII eked out a .14% gain. Individual security returns exclude dividends.
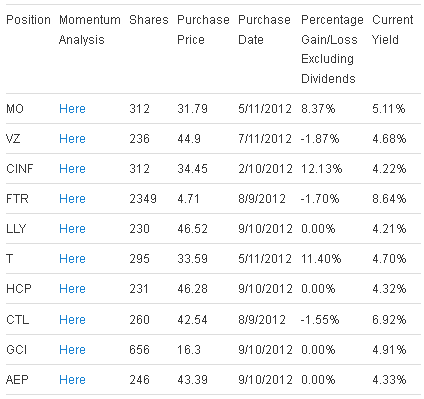
The proceeds were used to purchase positions in Eli Lilly & Co (LLY), HCP Inc (HCP), Gannett Co. (GCI), and American Electric Power (AEP). LLY currently yields 4.21%, HCP 4.32%, GCI 4.91%, and AEP 4.33%.
The High Yield Momentum Portfolio was designed to be fully invested at all times regardless of market conditions. However, as part of a larger portfolio there may be additional steps an investor can take to reduce risk and diversify strategies. For example, the Ivy Portfolio uses a 10 month moving average to dictate an invested or cash position (signals are updated daily at Scott’s Investments). An investor could hedge long positions by shorting (or purchasing an inverse ETF) an equity market index such as the S&P 500 when it trades below a long-term moving average.
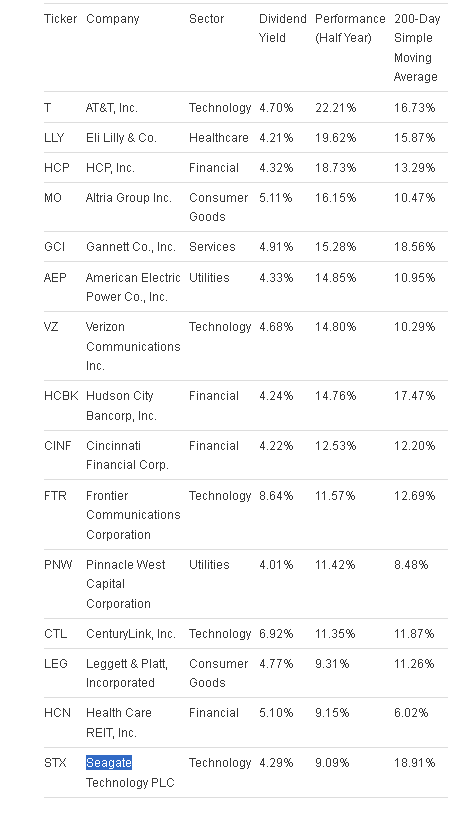
Below are the top 15 high yield momentum stocks as of September 10th. Keep in mind that only 10 stocks are held in the portfolio, the current holdings can be viewed on the right-hand side of Scott’s Investments and in the second table below.

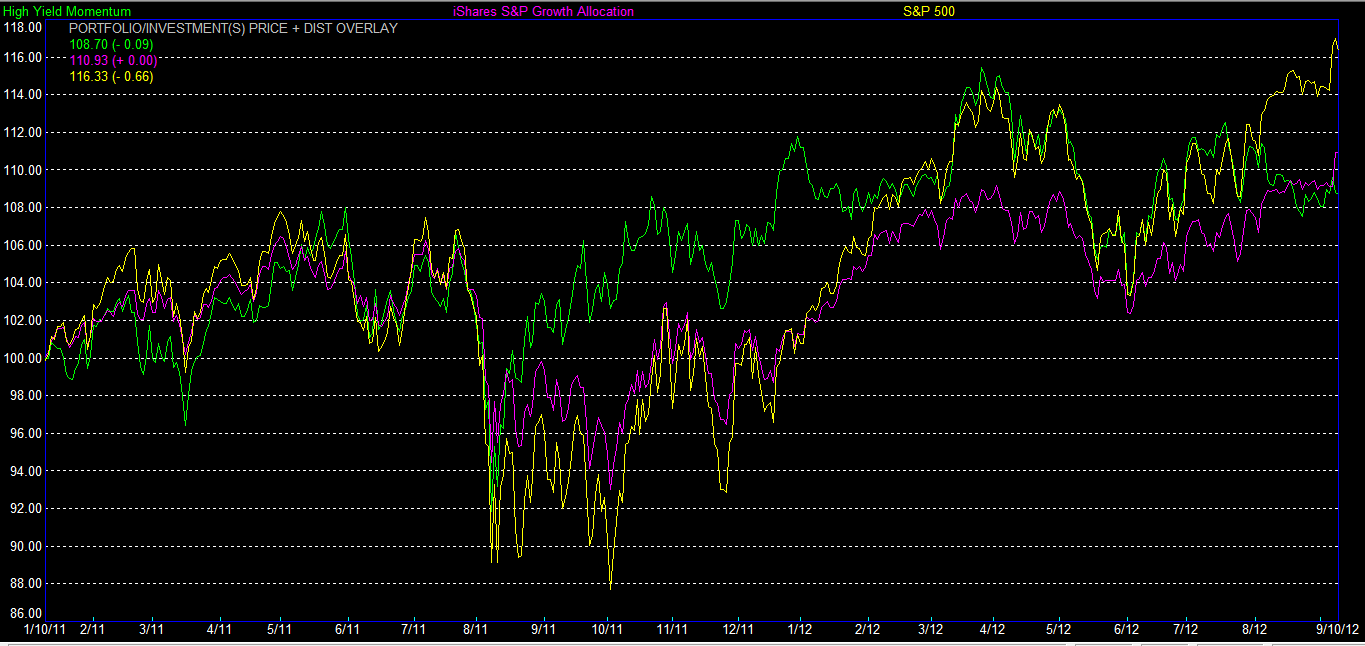
Since inception the portfolio is up 8.81% including dividends. Returns exclude commissions and taxes. Given the high turnover of the strategy, the results to this point are underwhelming. The chart below compares the returns of this strategy to SPY and AOR, the iShares S&P Growth Allocation ETF:
- English (UK)
- English (India)
- English (Canada)
- English (Australia)
- English (South Africa)
- English (Philippines)
- English (Nigeria)
- Deutsch
- Español (España)
- Español (México)
- Français
- Italiano
- Nederlands
- Português (Portugal)
- Polski
- Português (Brasil)
- Русский
- Türkçe
- العربية
- Ελληνικά
- Svenska
- Suomi
- עברית
- 日本語
- 한국어
- 简体中文
- 繁體中文
- Bahasa Indonesia
- Bahasa Melayu
- ไทย
- Tiếng Việt
- हिंदी
High Yield Stock Momentum Portfolio
Latest comments
Loading next article…
Install Our App
Risk Disclosure: Trading in financial instruments and/or cryptocurrencies involves high risks including the risk of losing some, or all, of your investment amount, and may not be suitable for all investors. Prices of cryptocurrencies are extremely volatile and may be affected by external factors such as financial, regulatory or political events. Trading on margin increases the financial risks.
Before deciding to trade in financial instrument or cryptocurrencies you should be fully informed of the risks and costs associated with trading the financial markets, carefully consider your investment objectives, level of experience, and risk appetite, and seek professional advice where needed.
Fusion Media would like to remind you that the data contained in this website is not necessarily real-time nor accurate. The data and prices on the website are not necessarily provided by any market or exchange, but may be provided by market makers, and so prices may not be accurate and may differ from the actual price at any given market, meaning prices are indicative and not appropriate for trading purposes. Fusion Media and any provider of the data contained in this website will not accept liability for any loss or damage as a result of your trading, or your reliance on the information contained within this website.
It is prohibited to use, store, reproduce, display, modify, transmit or distribute the data contained in this website without the explicit prior written permission of Fusion Media and/or the data provider. All intellectual property rights are reserved by the providers and/or the exchange providing the data contained in this website.
Fusion Media may be compensated by the advertisers that appear on the website, based on your interaction with the advertisements or advertisers.
© 2007-2025 - Fusion Media Limited. All Rights Reserved.
