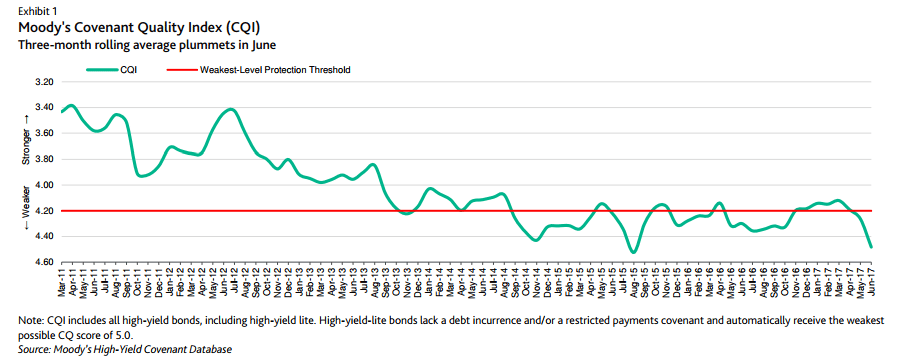
Covenant Quality is terrible but is it a long-term trend or skewed because of one month's data?
It’s never been better to be a high-yield issuer or high-yield investor. According to Moody’s, the US high-yield default rate fell to a two-year low in the first quarter amid commodity-price stability and lack of debt-payment pressures after a long period of bond refinancing and maturity extensions.
Additionally, Moody’s Liquidity Stress Index slumped to its lowest level since November 2014 last month on the back of improving corporate earnings and accommodative credit markets. These favorable conditions should have sparked a rush to issue high-yield debt, but so far high-yield issuance has disappointed. Issuance to June 8 was $131 billion, the second-lowest volume since 2010 with two-thirds of the volume earmarked for refinancing according to Bloomberg.
However, in Europe the situation is a little different. Companies sold €1.5 billion of notes with the ratings of at least seven levels below investment grade last week, the busiest week since April 2014. In what could be interpreted as a marker of a lack of fiscal discipline, more European companies are taking on debts to pay dividends. According to Bloomberg, always have issued €3.5 billion of bonds this year to pay shareholders, compared with €450 million in the same period last year.
Still, it seems that investors are so desperate for yield that they are willing to pay up, even for the riskiest types of debt and according to Moody’s, investors are not asking for anything in return.
Covenant Quality Worst Ever
In a new report from the credit rating agency, June corporate bonds provided the worst protection of any single month on record for investors. According to Moody’s Covenant Quality Index, US and Canadian bonds issued during the month of June had a quality rating of 4.48, weakening from 4.26 in May and only four basis points of the record worst 4.52 set in August 2015. The CQI now sits 109 basis points weaker than its record-best of 3.39 in April 2011 and 45 basis points weaker than its historical average of 4.03. Moody’s notes that the low June CQI score was a result of the “highest concentration of high-yield-lite bonds we have ever seen and a high volume of private-equity sponsored bonds featuring weakest-level protection.” The report continues, “HY-lite bonds represented a record 60% of June’s single-month issuance and a record 47% of bonds included in the June CQI.”
One explanation for this could be the higher than the average number of Ba-rated bonds issued last month, as the Moody’s report explains:
Concentration of Ba-rated bonds continues to increase. Nearly 47% of bonds in the June CQI carry a Ba rating, outpacing the historical average of 33%. This percentage has increased for six consecutive months, starting in December when it stood at 27%. Ba-rated bonds feature the least protective covenants so an increase in their issuance generally correlates to a weakening in the CQI. This month, as the Ba concentration increased, CQ scores for the Ba-rated bonds weakened to 4.84 from 4.62 in May, intensifying the impact on the CQI. The historical average CQ score for Ba-rated bonds is 4.45.

