Stock market records have a way of enthralling everyone. However, the stock market is not currently reflecting the economy or the corporate backdrop.
Stock market records have a way of enthralling everyone. However, the stock market is not currently reflecting the economy or the corporate backdrop.
For example, one may hear that the job market is strong. Yet job growth and job openings are both fading.
One may be told that the consumer is spending. On the other hand, year-over-year retail sales (2.88%) are well below last year (4.58%).
In a similar vein, The Bloomberg Consumer Comfort Index fell to a nine-month low of 58. The measure even posted its steepest three-week slide since 2008.
Meanwhile, manufacturing remains mired in an outright slump. The most recent data on industrial production came in at a three and a half year low.
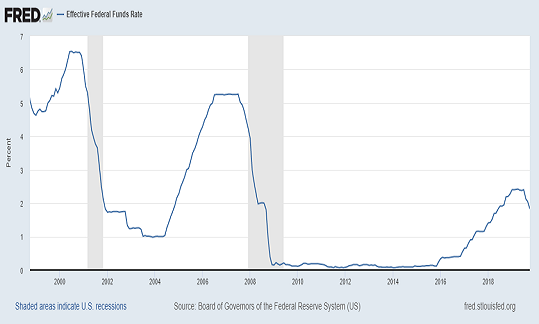
There’s a straightforward reason why the Federal Reserve cut its overnight lending rate three consecutive times. It did so because the economy is shaky.
Would Fed committee members be looking to provide monetary stimulus if prospects were wonderful? Keep in mind, the Fed is projecting fourth quarter economic growth at just 0.4%.
Corporations are hardly bucking the economic trend. Earnings have been negative for three consecutive quarters. It is likely to be negative for all of 2019.
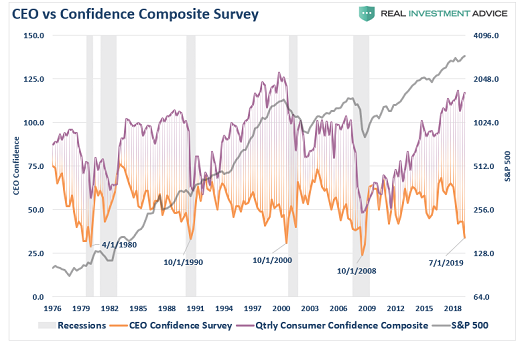
Equally disturbing? CEO confidence has slipped to levels that preceded the prior four recessions.
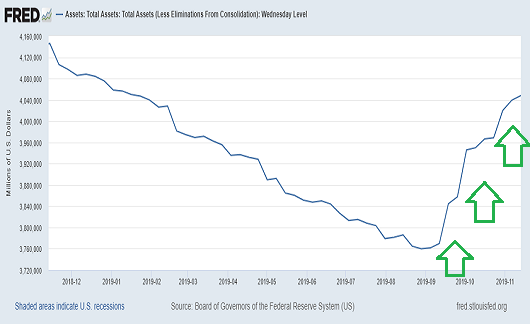
Why, then, is the stock market breaking higher? With six straight weeks of upward movement? Massive inflows of central bank liquidity.
Just one year ago, stocks were free-falling. It was happening because the Fed had planned to hike rates throughout 2019 and had intended to reduce the size of its balance sheet (a.k.a. “quantitative tightening” or “QT”) into 2020.
Instead, overnight lending rates were slashed in 2019. And when that did not satisfy financial market participants, the Fed began pumping hundreds of billions back into the system (a.k.a. “quantitative easing” or “QE”). Stocks have been rocking ever since!
With the Fed throwing monetary spaghetti at the “Wall,” nobody wants to be caught short. Consider the CBOE Equity Put Call Ratio. According to Dana Lyons, the measure just registered one of its lowest readings (
Other signs of giddiness? Investors Intelligence reported advisory sentiment at 57% bulls versus 18% bears. And Citi’s Greed Fear Index recently moved into “extreme greed” territory.
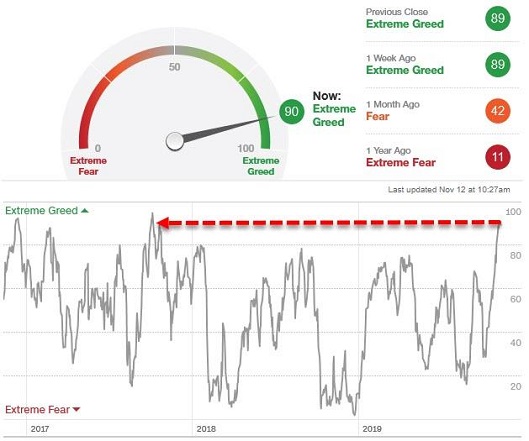
Historically speaking, irrational stock market enthusiasm has been a time to reduce risk, not take substantially more of it. The best time to embrace risk with everything you’ve got? When there is panic and hopelessness.
Is this time different? After all, the Fed’s injections of liquidity have trumped the need for corporations to increase their profits. In many instances, profitless corporations without a path to profitability have still seen their shares soar.
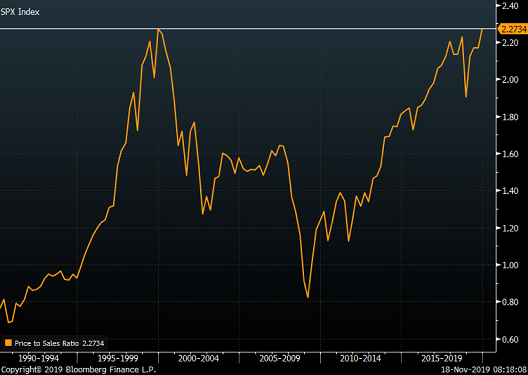
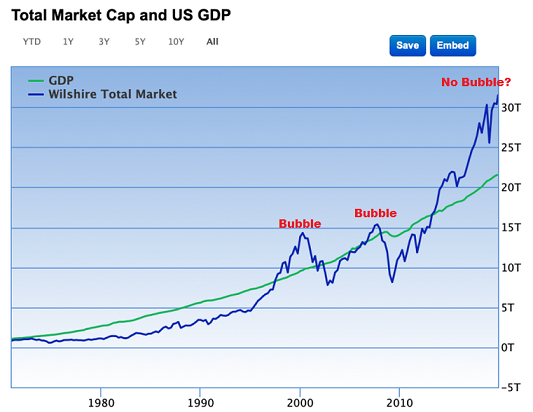
The price one pays for bottom line earnings has become irrelevant. What about revenue? The price one pays for corporate sales is as insane as it was during the turn-of-the century stock bubble.
Some of us remember when Warren Buffett described market cap to GDP as the best indicator of whether stocks are overvalued or undervalued. In the era of QE, though, valuation has been little more than a quaint concept.
What will happen when over-leveraged, profit-challenged corporations struggle to generate business and scramble to pay debts? Companies will freeze hiring and, eventually, announce layoffs.
It may not happen all at once in crisis-like fashion. Still, employees and independent contractors will become concerned about their pay and consume less.
Investors may need to ask themselves, will the Fed have enough ammunition to prevent the economy from stagnating? From shrinking? Can their actions prop up stocks indefinitely, or is it more plausible that a “wealth effect reversal” occurs in spite of monetary policy magic?
Many agree with the notion that the Fed has created a super-sized asset balloon. On the flip side, some of these folks cannot see a pin prick in their front-view windshields.
It follows that they’re not inclined to ratchet down their exposure to risk assets. Instead, they think they can get out before a mad rush for the exits.
Some will. Some won’t.
I would argue that it does not matter what pops the balloon to lead to the next bear in stocks. It could be a loss of faith in foreign central banks or a loss of faith in Federal Reserve policy (e.g., too little QE, too much QE, too slow with stimulus, too fast with stimulus, etc.). It could be an unwinding of leverage from the leveraged loan arena to margin debt to BBB-rated corporate downgrades. It could be a sharp shift away from stock buybacks. It could be a chain reaction of negative sentiment surrounding “unicorns.”
It could be almost anything. And in all likelihood, it will be identified in hindsight.
Identifying the pin or pins beforehand is less critical than having a plan for a dangerous downturn. That plan should incorporate hedging one’s exposure to common stock as well as reducing one’s exposure.
The most effective hedges tend to be a combination of the highest “quality” government bonds, precious metals like gold and currencies like the dollar. ETFs like iShares 20+ Year Treasury Bond (NASDAQ:TLT), iShares 7-10 Year Treasury Bond (NASDAQ:IEF), SPDR® Gold Shares (NYSE:GLD) and PowerShares DB US Dollar Bullish (NYSE:UUP) provided non-correlation with U.S. stocks and protection against capital depreciation in 2008.
If you are concerned that hedging alone won’t do the trick, consider Pacer Trendpilot 750 (NYSE:PTLC). It participates in technical market uptrends while systematically shifting to T-bills if technical trends turn down.
Disclosure Statement: ETF Expert is a web log (“blog”) that makes the world of ETFs easier to understand. Gary Gordon, MS, CFP is the president of Pacific Park Financial, Inc., a Registered Investment Adviser with the SEC. Gary Gordon, Pacific Park Financial, Inc., and/or its clients may hold positions in the ETFs, mutual funds, and/or any investment asset mentioned above. The commentary does not constitute individualized investment advice. The opinions offered herein are not personalized recommendations to buy, sell or hold securities. At times, issuers of exchange-traded products compensate Pacific Park Financial, Inc. or its subsidiaries for advertising at the ETF Expert website. ETF Expert content is created independently of any advertising relationship.
For example, one may hear that the job market is strong. Yet job growth and job openings are both fading.
One may be told that the consumer is spending. On the other hand, year-over-year retail sales (2.88%) are well below last year (4.58%).
In a similar vein, The Bloomberg Consumer Comfort Index fell to a nine-month low of 58. The measure even posted its steepest three-week slide since 2008.
Meanwhile, manufacturing remains mired in an outright slump. The most recent data on industrial production came in at a three and a half year low.
There’s a straightforward reason why the Federal Reserve cut its overnight lending rate three consecutive times. It did so because the economy is shaky.
Would Fed committee members be looking to provide monetary stimulus if prospects were wonderful? Keep in mind, the Fed is projecting fourth quarter economic growth at just 0.4%.
Corporations are hardly bucking the economic trend. Earnings have been negative for three consecutive quarters. It is likely to be negative for all of 2019.
Equally disturbing? CEO confidence has slipped to levels that preceded the prior four recessions.

Why, then, is the stock market breaking higher? With six straight weeks of upward movement? Massive inflows of central bank liquidity.
Just one year ago, stocks were free-falling. It was happening because the Fed had planned to hike rates throughout 2019 and had intended to reduce the size of its balance sheet (a.k.a. “quantitative tightening” or “QT”) into 2020.
Instead, overnight lending rates were slashed in 2019. And when that did not satisfy financial market participants, the Fed began pumping hundreds of billions back into the system (a.k.a. “quantitative easing” or “QE”). Stocks have been rocking ever since!

With the Fed throwing monetary spaghetti at the “Wall,” nobody wants to be caught short. Consider the CBOE Equity Put Call Ratio. According to Dana Lyons, the measure just registered one of its lowest readings (
Other signs of giddiness? Investors Intelligence reported advisory sentiment at 57% bulls versus 18% bears. And Citi’s Greed Fear Index recently moved into “extreme greed” territory.

Historically speaking, irrational stock market enthusiasm has been a time to reduce risk, not take substantially more of it. The best time to embrace risk with everything you’ve got? When there is panic and hopelessness.
Is this time different? After all, the Fed’s injections of liquidity have trumped the need for corporations to increase their profits. In many instances, profitless corporations without a path to profitability have still seen their shares soar.
The price one pays for bottom line earnings has become irrelevant. What about revenue? The price one pays for corporate sales is as insane as it was during the turn-of-the century stock bubble.

Some of us remember when Warren Buffett described market cap to GDP as the best indicator of whether stocks are overvalued or undervalued. In the era of QE, though, valuation has been little more than a quaint concept.

What will happen when over-leveraged, profit-challenged corporations struggle to generate business and scramble to pay debts? Companies will freeze hiring and, eventually, announce layoffs.
It may not happen all at once in crisis-like fashion. Still, employees and independent contractors will become concerned about their pay and consume less.
Investors may need to ask themselves, will the Fed have enough ammunition to prevent the economy from stagnating? From shrinking? Can their actions prop up stocks indefinitely, or is it more plausible that a “wealth effect reversal” occurs in spite of monetary policy magic?

Many agree with the notion that the Fed has created a super-sized asset balloon. On the flip side, some of these folks cannot see a pin prick in their front-view windshields.
It follows that they’re not inclined to ratchet down their exposure to risk assets. Instead, they think they can get out before a mad rush for the exits.
Some will. Some won’t.
I would argue that it does not matter what pops the balloon to lead to the next bear in stocks. It could be a loss of faith in foreign central banks or a loss of faith in Federal Reserve policy (e.g., too little QE, too much QE, too slow with stimulus, too fast with stimulus, etc.). It could be an unwinding of leverage from the leveraged loan arena to margin debt to BBB-rated corporate downgrades. It could be a sharp shift away from stock buybacks. It could be a chain reaction of negative sentiment surrounding “unicorns.”
It could be almost anything. And in all likelihood, it will be identified in hindsight.
Identifying the pin or pins beforehand is less critical than having a plan for a dangerous downturn. That plan should incorporate hedging one’s exposure to common stock as well as reducing one’s exposure.
The most effective hedges tend to be a combination of the highest “quality” government bonds, precious metals like gold and currencies like the dollar. ETFs like iShares 20+ Year Treasury Bond (NASDAQ:TLT), iShares 7-10 Year Treasury Bond (NASDAQ:IEF), SPDR® Gold Shares (NYSE:GLD) and PowerShares DB US Dollar Bullish (NYSE:UUP) provided non-correlation with U.S. stocks and protection against capital depreciation in 2008.
If you are concerned that hedging alone won’t do the trick, consider Pacer Trendpilot 750 (NYSE:PTLC). It participates in technical market uptrends while systematically shifting to T-bills if technical trends turn down.
Disclosure Statement: ETF Expert is a web log (“blog”) that makes the world of ETFs easier to understand. Gary Gordon, MS, CFP is the president of Pacific Park Financial, Inc., a Registered Investment Adviser with the SEC. Gary Gordon, Pacific Park Financial, Inc., and/or its clients may hold positions in the ETFs, mutual funds, and/or any investment asset mentioned above. The commentary does not constitute individualized investment advice. The opinions offered herein are not personalized recommendations to buy, sell or hold securities. At times, issuers of exchange-traded products compensate Pacific Park Financial, Inc. or its subsidiaries for advertising at the ETF Expert website. ETF Expert content is created independently of any advertising relationship.
Which stock should you buy in your very next trade?
AI computing powers are changing the stock market. Investing.com's ProPicks AI includes 6 winning stock portfolios chosen by our advanced AI. In 2024 alone, ProPicks AI identified 2 stocks that surged over 150%, 4 additional stocks that leaped over 30%, and 3 more that climbed over 25%. Which stock will be the next to soar?
Unlock ProPicks AI