The crude oil market is capable of going from a state of oversupply to one of not enough supply in relatively short time. OPEC and Russia’s decisions and the fact that in a normal year the world consumes over 100 million barrels of oil daily cause the pendulum to swing from glut to deficit quite quickly.
At the start of this month OPEC announced it is going to keep production steady through April. The vaccines rollout and ongoing economic recovery, in the meantime, come with gradually increasing oil consumption. And while it is probably too early to talk about a supply deficit, it is also true that WTI prices went from -$38 to almost $68 a barrel in less than a year.
Why then did the price of crude oil suddenly drop 14% over the past two weeks? From a fundamental macro perspective, the exact reason remains hard to pinpoint. From an Elliott Wave point of view, though, that plunge was not only logical but also predictable.

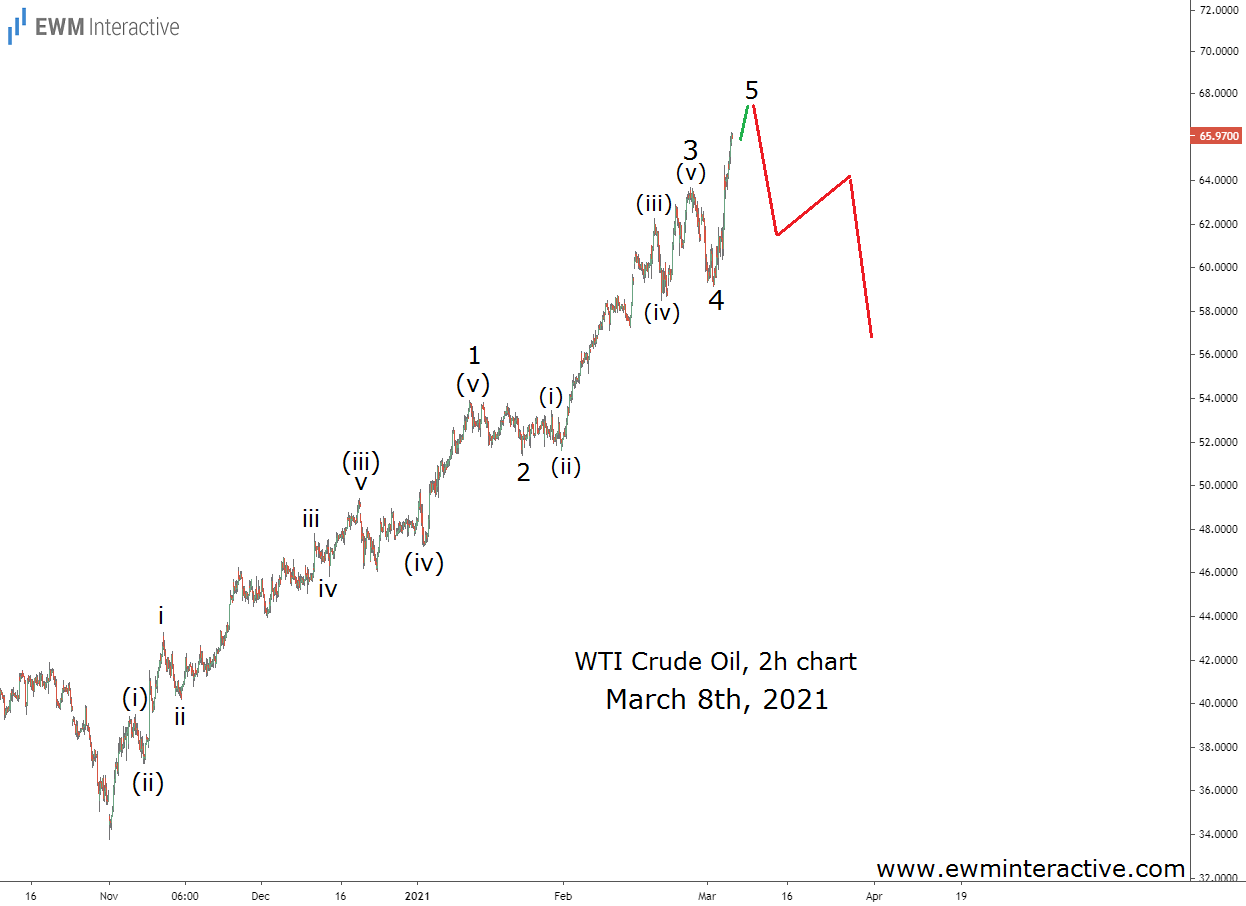
The chart above was sent to our subscribers before the market opened on Monday, Mar. 8. It focused on the fact that the structure of the rally from $33.78 was impulsive. The pattern was labeled 1-2-3-4-5, where the sub-waves of 1 and 3 were also visible.
Crude Oil Bears Return with a Bang
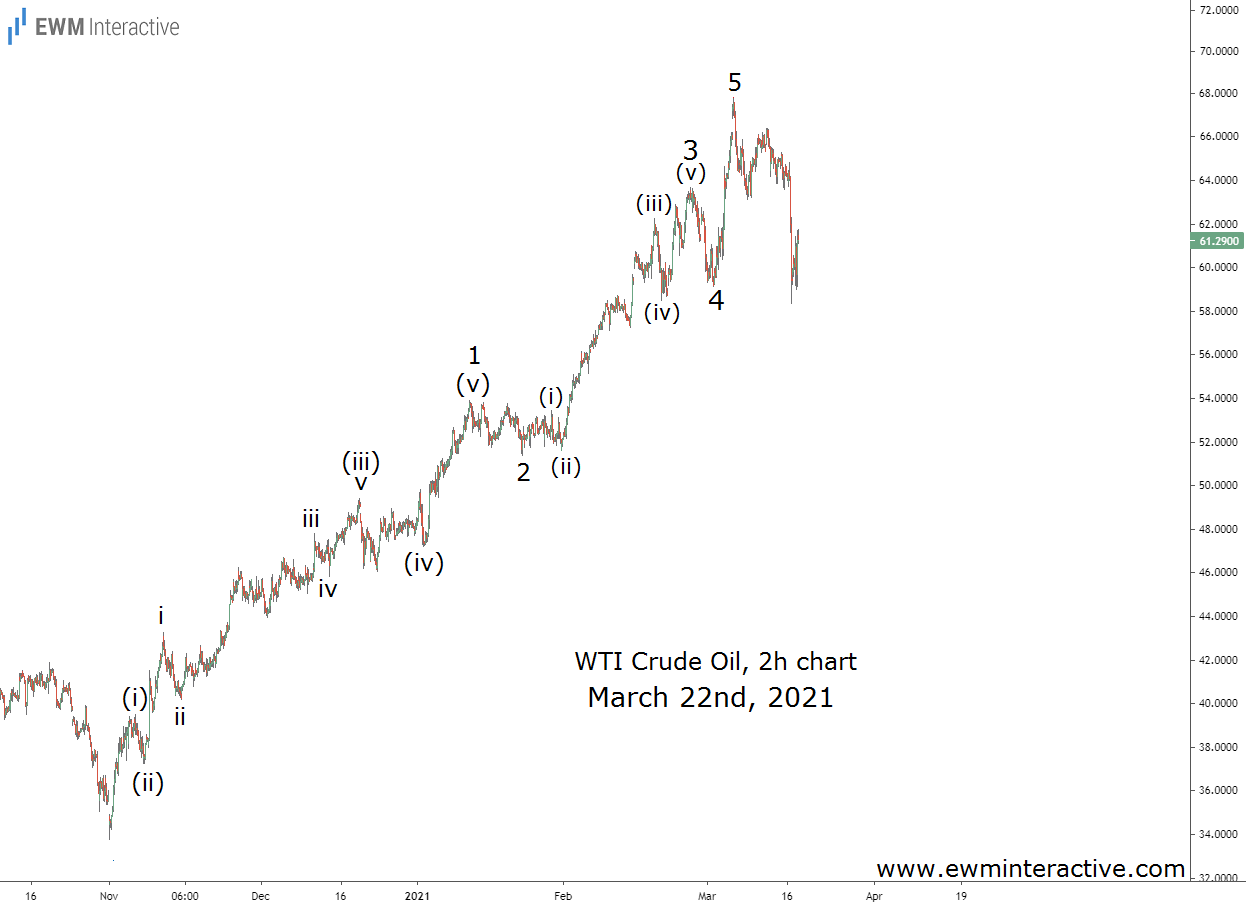
According to the Elliott Wave theory, a three-wave correction follows every impulse. So, instead of blindly extrapolating the recent strength into the future, we thought it was time for a notable bearish reversal. Corrections usually erase the entire fifth wave of the preceding impulse. Here, this meant a dip at least to the support area of wave 4 could be expected. The chart below shows WTI’s development over the following two weeks.

Crude oil opened with the so-called exhaustion gap and reached as high as $67.80 the same day. From then on, however, the bears took complete control of the situation. Ten days, later, on Mar. 18, the price was already down 14% to $58.27. As expected, the entire progress made by wave 5 has been erased.
We have no idea how the pandemic is going to unfold nor what OPEC+ is planning. What we do know is that in the search for future guidance it pays to look for Elliott Wave patterns.
