If you’re worried inflation will sideswipe your portfolio, well, you have good reason to be. Because make no mistake, rising prices will be the story of 2018. And if you want to protect your portfolio, you need to act now. I’ll show you how a little further on.
First, let’s go toe to toe with the inflation boogeyman, and see what kind of punch we can expect him to pack this year.
A Growing Threat
Starting late last year, the consumer price index (CPI) jumped, and the increase is accelerating as we start 2018.
Prices Heat Up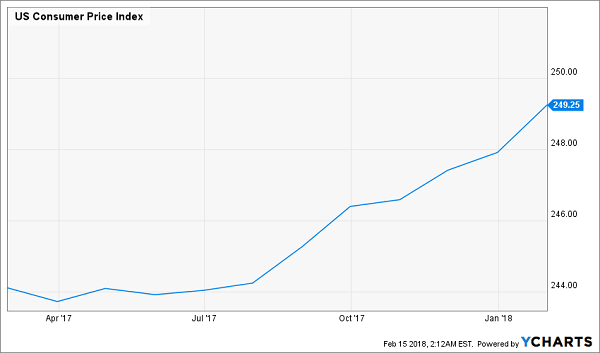
Of course, that’s probably not news to you; it’s been covered daily in the media. And keep in mind that the CPI is a measure of consumer prices—that is, the prices everyday Americans spend at the gas pump, in the grocery store, in the shopping mall and online.
But there’s another, more important (and almost always ignored) piece of the puzzle: the producer price index (PPI).
It measures the cost of raw materials and services companies use to make the things consumers buy. And now, the PPI is raising alarm bells for those who are paying attention.
A Feedback Loop Kicks Off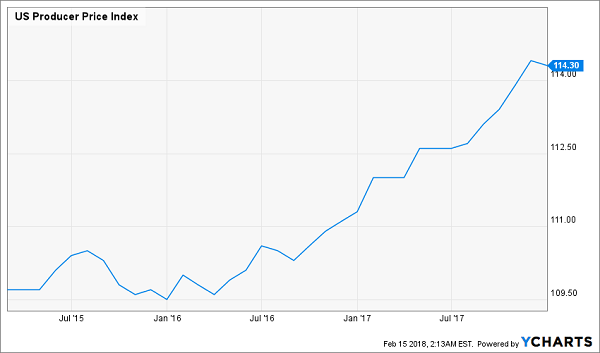
For the last couple years, consumer prices have been grinding higher while the prices producers pay haven’t gone anywhere. That’s been great for companies that make products out of raw materials. But with producer prices climbing faster, the game has changed.
In 2015 and 2016, companies that sold to consumers could boost their profits thanks to a low PPI and a better job market (which raised incomes, letting companies hike prices).
Fast-forward to today, and companies no longer have the benefit of a low PPI, which means they’ll either need to lower their profits by eating these extra costs (something that would put many overhyped Dividend Aristocrats’ dividends in a vise), or they’ll have to raise prices further.
Expect most companies to do the latter. Because, since job gains are still healthy, they can slip those hikes by without consumers taking much notice—which is what’s happening.
Back to the ’70s?
Last week, the Bureau of Labor Statistics shocked the market with a bigger than expected jump in inflation. While economists predicted a 0.3% rise, we saw a 0.5% jump.
That doesn’t sound like much, but keep in mind we’re talking about a change from the prior month. If we see that rate keep up, we’d see prices jump 6% from last year. America hasn’t seen inflation like that since the 1970s!
And that’s why the bond market is panicking.
The Bond Selloff
Look at this chart of the iShares 20+ Year Treasury Bond ETF (NASDAQ:TLT), a Treasury fund that gives investors exposure to long-term US government bonds.
Bonds Crashing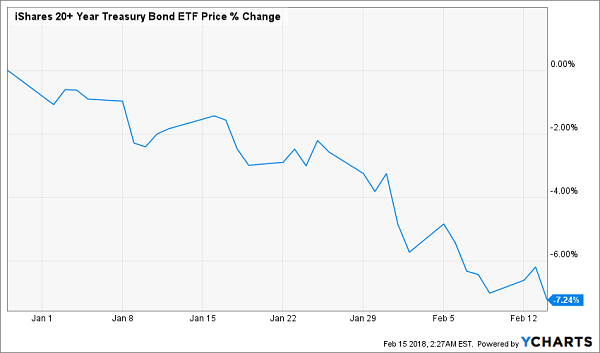
Keep in mind that this selloff began before the stock-market correction of early February.
Also keep in mind that this is a much worse performance than supposedly higher-risk junk bonds are turning in: they’re still down a bit from the stock-market correction but were flat before then, as you can see by comparing the SPDR Barclays High Yield Bond (NYSE:JNK) to TLT:
The Riskier Choice Is Doing Better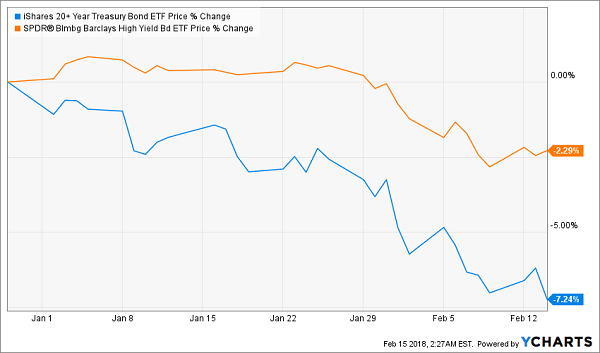
This has left a lot of folks scratching their heads. Why would riskier junk bonds, with their higher default rates and sensitivity to interest rates, be doing better than Treasuries?
If you think about it, it makes sense. Junk bonds are doing better because of inflation. Higher prices mean more demand, so the junk-rated companies issuing these bonds are seeing higher sales, which translate into more cash flow to pay off their debts.
The takeaway: while the inflation on the horizon is bad for Treasuries, it’s good for junk bonds.
The Fed Puzzle
There’s one more piece to consider: the Federal Reserve.
Remember that the Fed’s mandate is to keep inflation and unemployment from being too high or too low. With inflation surging, the Fed is under pressure to act. There’s one thing it can do: raise interest rates, which it has been doing—a lot.
A Quiet 400% Hike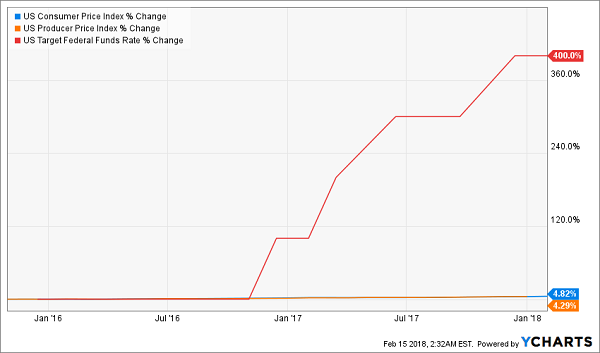
The fact that prices, corporate profits and sales have been going up despite the Fed’s 400% increase to borrowing costs means the economy is not only healthy but in danger of overheating. The Fed is knows this, which is why that 400% interest rate hike in 2.5 years is probably the tip of the iceberg.
Already, the Fed has promised to raise rates three times in 2018, and it seems likely that it will hike more than that.
Here’s where that leaves us: we’ve got a great opportunity to buy stocks (such as these 3 candidates from my colleague Brett Owens), and in particular high-yielding closed-end funds.
But you’ll want to steer clear of (and purge your portfolio of) companies with lackluster sales and earnings, as well as high debt levels. As the inflation wave builds, they’ll be the first to get swamped.
Disclosure: Brett Owens and Michael Foster are contrarian income investors who look for undervalued stocks/funds across the U.S. markets. Click here to learn how to profit from their strategies in the latest report, here.
