Financial professionals frequently opine that asset prices are a function of economic conditions. Assets like stocks, bonds and real estate rise in value when the economy is expanding. They fall in value when the economy contracts.
The problem with those statements is that they represent a flawed understanding of 21st-century credit cycles. In particular, recessionary pressures did not cause the tech wreck (2000-2002) nor the housing collapse (2008-2009); rather, the bursting of each asset bubble sparked the recession that followed.
Let’s examine the respective timelines.
In the latter half of the 1990s, the Federal Reserve’s easy money policies became even easier when the central bank slashed rates to contain the Asian Currency Crisis (1998). The Fed then scrambled to restrict the ubiquitous use of credit by rapidly tightening overnight lending rates from 1998’s low of 4.75% to May of 2000’s pinnacle of 6.5%.
Perhaps, unfortunately, the dot-com balloon had been pricked (3/2000). The severe price depreciation, particularly in tech stocks, led to consumers feeling much less wealthy and to businesses laying off millions of employees. Importantly, the stock bear occurred a full year prior to the recession’s inception in 2001.
What about the Great Recession in 2008? After many years of extremely loose monetary policy on the part of the Fed, tightening of the overnight lending rate topped out at 5.25% in 2006. Housing prices peaked at that very same time. They began dropping in earnest by 2007. Meanwhile, financial stocks via SPDR Financial Select Sector (NYSE:XLF) fell 20% in 2007.
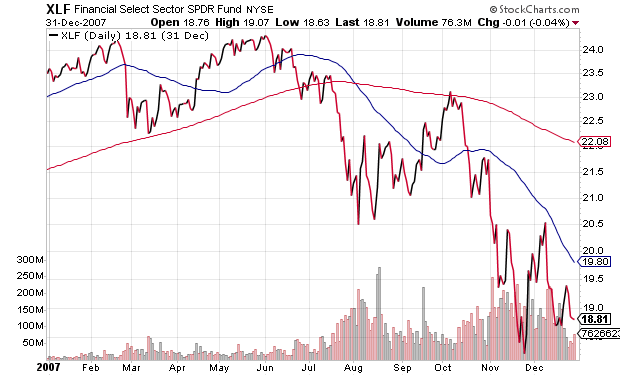
Once again, an asset bubble had burst. And a wealth effect reversal was underway, triggering a recession where millions lost their livelihoods and hundreds of millions slowed their consumption to a crawl.
In the same vein, then, the next recession will not cause stocks to plunge 30%, 40% or 50% in value. Rather, when the “Everything Balloon” pops, real estate prices will drop significantly and stocks will fall precipitously. The severity of the wealth effect reversal will trigger the next recession.
It is critical for investors to understand that the Federal Reserve knowingly and deliberately sparks psychological wealth effects. Members on the Fed’s Open Market Committee (FOMC), particularly previous chairs like Ben Bernanke and Janet Yellen, believe that actively encouraging higher asset prices increases the confidence of consumers and businesses. In turn, people spend more, aiding economic expansion.
What many FOMC members do not understand (or do not discuss) is how ultra-accommodating monetary policy creates more than wealth effects. It also creates asset bubbles. And when an asset bubble inevitably bursts, a wealth effect reversal eviscerates an economy.
Consider how household net worth as a percentage of economic growth used to be relatively stable. (See the orange semi-circle below.) After backing away from the “gold standard” in the 70s and shifting toward a consumption-based economy in the 80s, policymakers have consistently banked on credit to fuel conspicuous consumerism. The problem? Unsustainable wealth effects reverse themselves once asset bubbles explode.
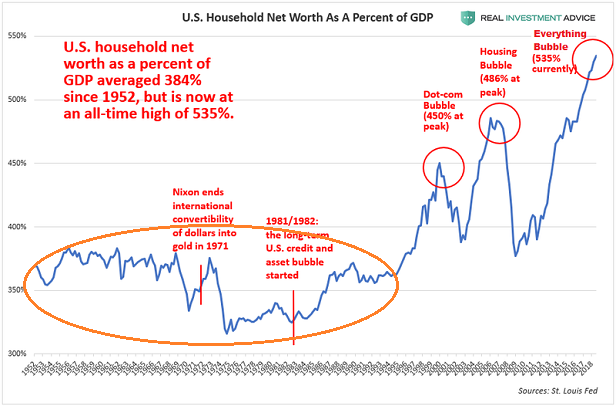
Effectively, ultra-loose monetary policies keep the cost of credit exceptionally low for an extended period of time. The Federal Reserve’s active manipulation fosters a wealth effect, but it also fosters an asset bubble. When the balloon inevitably pops, corporations batten down their hatches, unemployment surges and consumers rein in their consumption. This is the way that recessions happen today.
Why do older investors need to concern themselves with recognizing the pattern? For one thing, near-retirees and retirees cannot afford to spend many years getting back to a break-even point with their portfolios. In order to maintain their standards of living, most will require inflation-adjusted rates of return that are much greater than what the 21st century has delivered thus far.
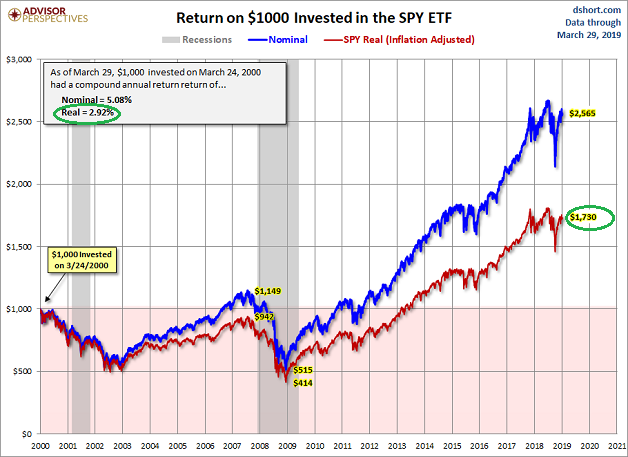
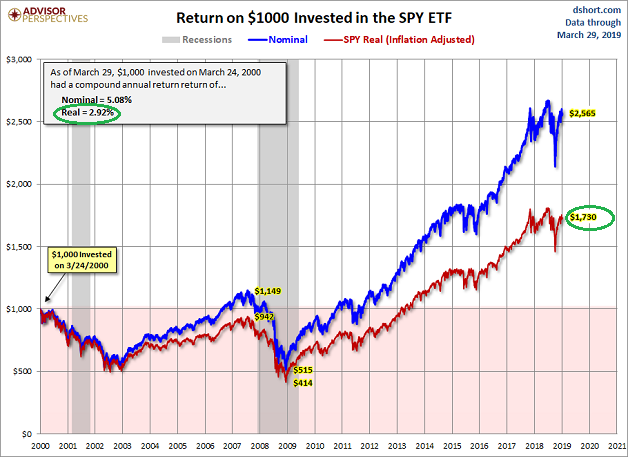
Take a look at the SPDR S&P 500 Trust (SI:SPY. With dividends reinvested, its real return is less than 3%.
Keep in mind, we have 2.9% real returns as we sit atop all-time record highs for stocks on the back side of the longest bull market in history. Eventually, the “Everything Balloon” will tear, exacting a hefty toll on the annualized percentages.
There’s more. Near-retirees and retirees are not going to invest 100% of their portfolios in stocks alone. Yet real returns for total bond market assets are in the same general area as real returns for stocks since 2000. (Naturally, those bond assets traveled a less risky path.)
However, the Federal Reserve’s determination to depress the cost of credit forevermore limits the prospects of bond returns in the future. Can a total bond index be counted on for 3% real returns over the next 20 years when the nominal yield for a 10-year Treasury is 2.5%? Hardly. Even the manipulation of bond yields lower has limits.
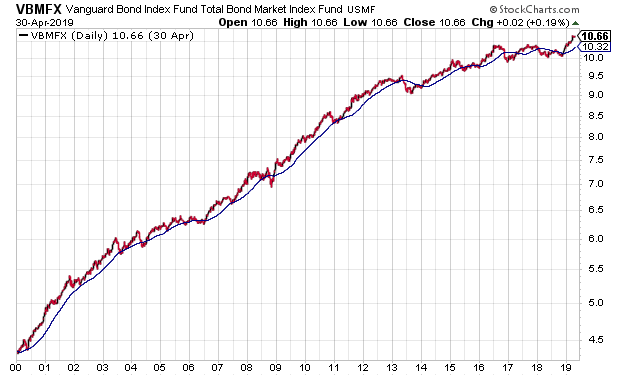
For scores of folks looking to maintain their standards of living throughout retirement years, real returns of 2.9% are not likely to be sufficient. Perhaps it will need to be 3.9% or 4.9%.
Sadly, due to Federal Reserve policy, this will not be achieved in risk-free CD savings. Nor is it likely to occur by holding a 60/40 mix of stocks and bonds for the next 20 years.
Indeed, there are harsh consequences of Federal Reserve activism. Near-retirees and retirees will need to be more active to meet their inflation-adjusted rate of return requirements.
They’re going to have to sell some stuff to limit the bearish outcome of the bursting of the “Everything Balloon.” Similarly, in the depths of recessionary despondency, they’re going to need the wherewithal (and principal) to buy great stuff at huge discounts.
Granted, it may not be possible to “time” market-based decisions perfectly. Nevertheless, there are simple methods that have beaten (or matched) the market over time with far less statistical risk (e.g., drawdown, Sharpe, Sortino, etc.).
For now, my near-retiree and retiree client base participate in upside gains, but with decidedly less risk than chasing the dragon. On the stock side of the ledger, I am opting for dividends and defense with ETFs like iShares MSCI Minimum Volatility (USMV), Vanguard High Dividend (VYM) and Invesco S&P MidCap Low Volatility (XMLV).
On the income side? I employ “preferreds” from companies whose investment grade debt profiles are several steps removed from “junk” status. Think Duke Energy Corporation (NYSE:DUK) 5.125% Junior Subordinated Debentures due 2073 (DUKH) and/or Stanley Black & Decker (NYSE:SWK), Inc. 5.75% Junior Subordinated Debenture due 2052 (SWJ). At this precarious moment in time, I am also fond of the ultra-short term income ETFs that produce 2.35%-2.55% like Invesco Ultra Short Duration (GSY) and JP Morgan Ultra Short Term Income (JPST).
Disclosure Statement: ETF Expert is a web log (“blog”) that makes the world of ETFs easier to understand. Gary Gordon, MS, CFP is the president of Pacific Park Financial, Inc., a Registered Investment Adviser with the SEC. Gary Gordon, Pacific Park Financial, Inc., and/or its clients may hold positions in the ETFs, mutual funds, and/or any investment asset mentioned above. The commentary does not constitute individualized investment advice. The opinions offered herein are not personalized recommendations to buy, sell or hold securities. At times, issuers of exchange-traded products compensate Pacific Park Financial, Inc. or its subsidiaries for advertising at the ETF Expert website. ETF Expert content is created independently of any advertising relationship.
