Today I will post a few charts, all of which show that major asset classes are at some kind of a short term inflection points. It is difficult to predict whether support and resistance levels for these major assets will hold, so speculators need to pay close attention to the tape in the coming days.
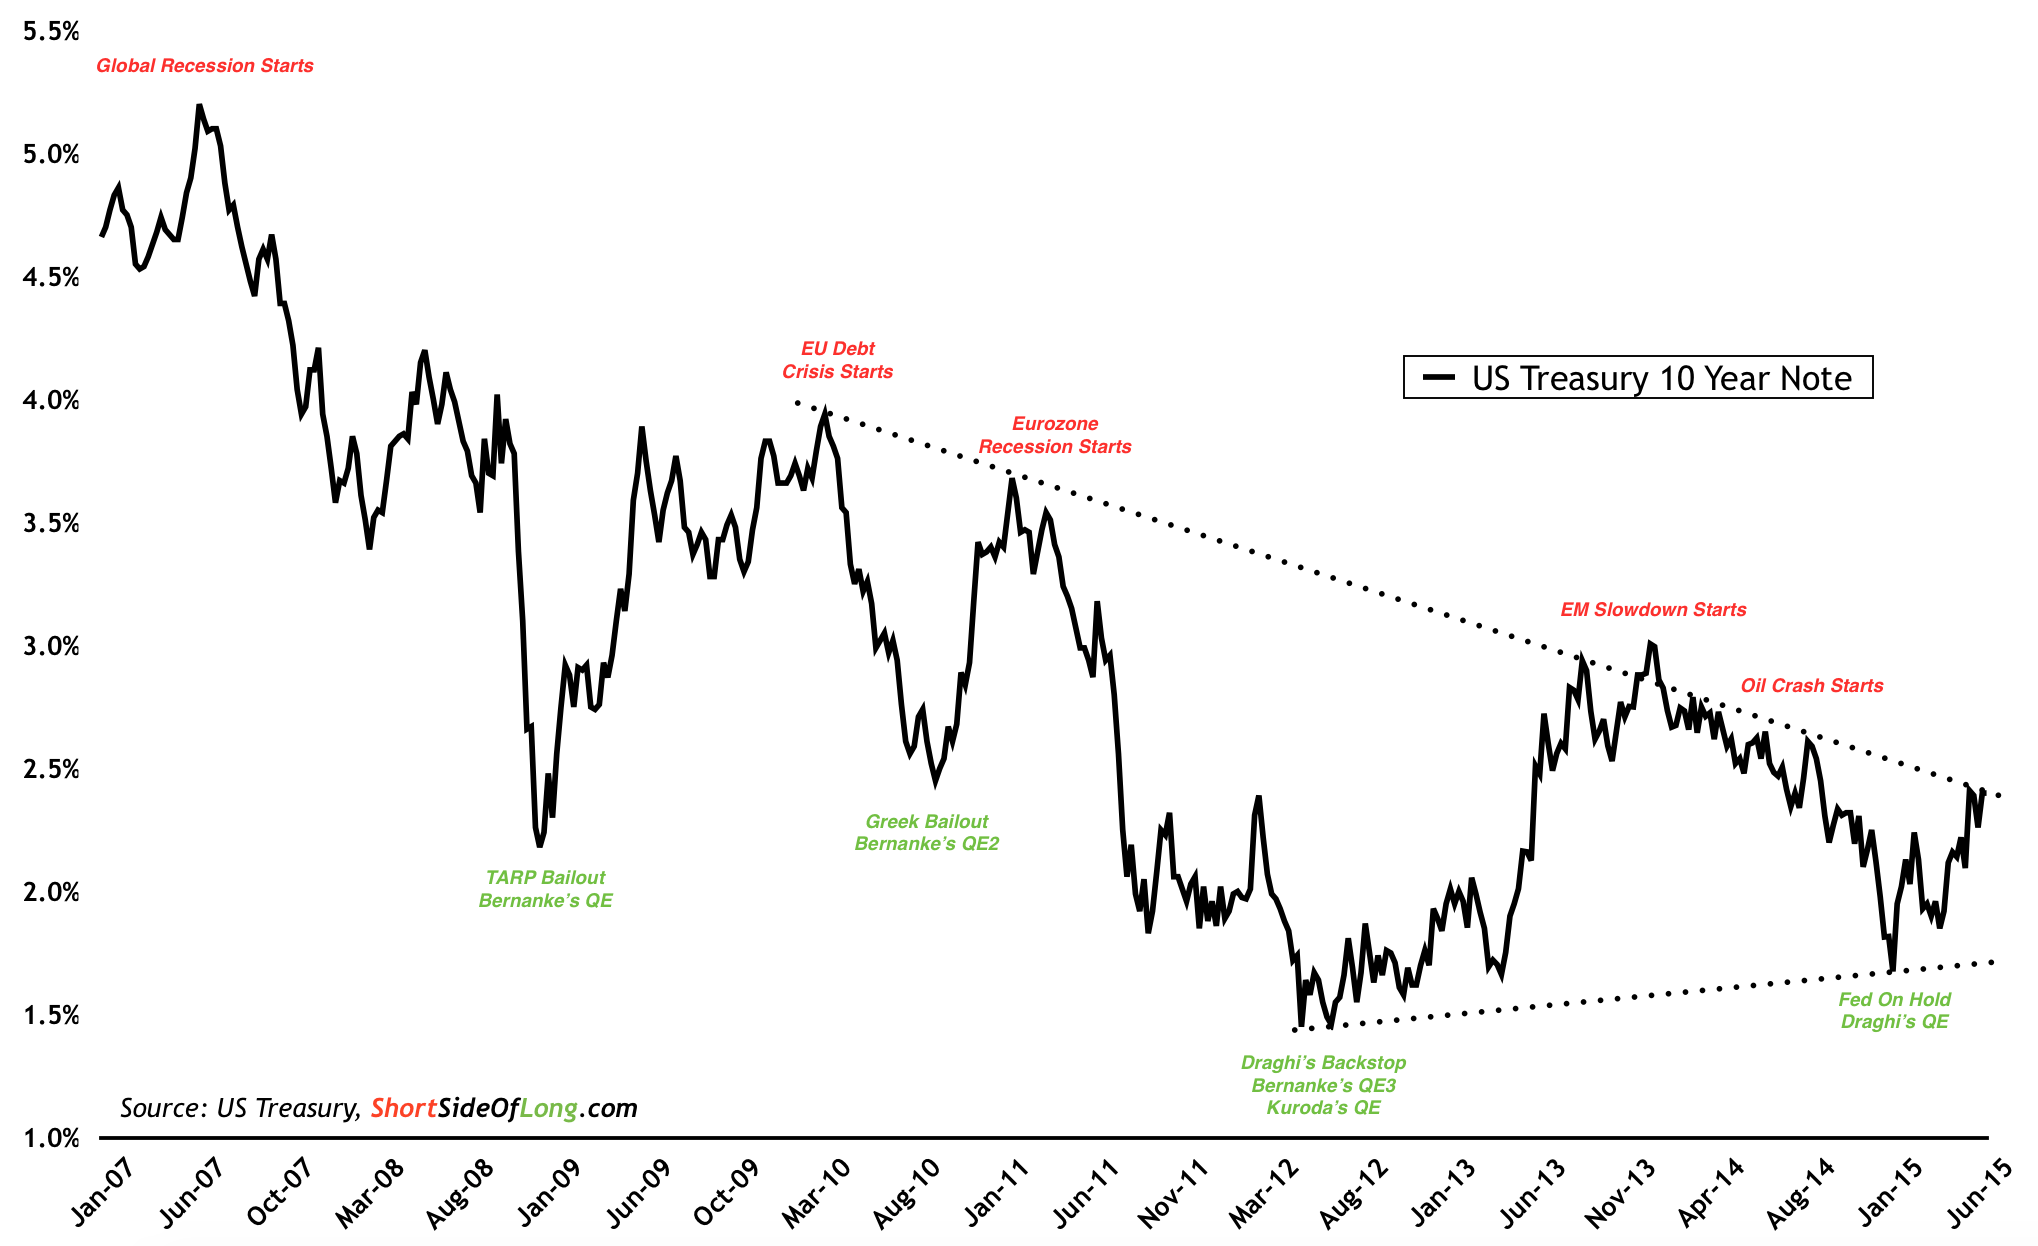
The first chart of the day turns our attention to interest rates, in particular the U.S. 10-Year Treasury Note. We can see that support was found at the beginning of the year, as rates dipped below 2% again. The move was quickly reversed since the Fed remains on hold for longer than expected and the ECB's QE backstopped the Eurozone's problems for a time.
Chart Of The Day: 10 Year Treasury Yield at important resistance
The truth is, the bond market is very smart. Interest rates tend to stop rising and peak out as soon as Mr Market figures out something is wrong within the global economy. In the middle of 2007, bond yields peaked and started dropping just as the GFC (Global Financial Crisis) was beginning, while in both early 2010 and early 2011 bond yields declined into Eurozone problems. In late 2013, it was the Emerging Markets slowdown, while in middle of 2014 Oil price started to crash, creating disinflation and forcing the Fed to remain on hold for longer.
Recently, the bond market started discounting the Federal Reserve's up and coming policies, in particular the possibility of interest rates moving higher. But now the yields seem to have stopped rising again. It seems that the Greek Drama (it's not really a crisis anymore) has yet again shaken up financial markets and corporate confidence.
If interest rates stop rising at the current resistance level, what might the bond market be pricing in next?

