One of the many tenets on Wall Street is that debt investors are often a step or two ahead of stock investors when it comes to identifying slowing economic growth. From a common-sense perspective, it makes some sense. Debt investors tend to be more risk averse and thus may dot a few more due diligence i’s and cross a few more analytical t’s. While the flurry of M&A activity has been a boon for stocks, balance-sheet-aware fixed income investors are becoming concerned. From Bloomberg:
Corporate dealmaking that helped propel the Standard & Poor’s 500 stocks index to a record is playing out differently for debt investors, who must contend with the biggest threat to credit grades since 2009. With borrowings to fund mergers and acquisitions accelerating amid an improving economy, the number of credit-ratings cuts linked to such deals is exceeding increases by the most since the fourth quarter of 2009, according to data from Moody’s Analytics. The firm’s credit-assessment unit lowered 96 ratings during the year ended March, while raising the rankings on 78.
Tone In Credit Has Shifted Noticeably
Back in mid-December, a Barron’s article noted bond investors were worried about rising interest rates, rather than defaults:
As 2013 winds down, bond investors remain much more worried about interest-rate risk, which is what caused all those bond-fund price declines in May and June, than about default risk, or the risk that a bond issuer won’t be able to pay back its debt. That what-me-worry attitude toward default risk gets further support from the latest statistics from Moody’s Investor’s Service, which reports today that the default rate among junk-rated U.S. companies fell further to 2.4% in November from 2.5% in October, barely more than half its long-term historic average and down from 3.1% a year ago.
Similarities To 2007-2008?
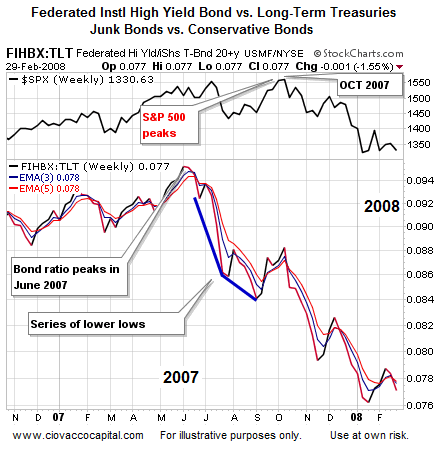
One way to evaluate any situation in the markets is to compare the present day to previous bearish market turns and look for similarities. The Junk Bond Spider ETF (ARCA:JNK) can be used as an excellent proxy for the high-yield debt markets. Since JNK did not start trading until 2008, to go back to the stock market’s October 2007 peak, the graph below uses a mutual fund (FIHBX) as a proxy for JNK. The top of the chart shows the S&P 500 for comparison purposes. The ratio of junk debt to conservative debt is below the S&P 500. When the bond ratio rises, demand for junk bonds is greater than demand for conservative Treasuries. Were the debt markets a step ahead of stocks in 2007? Yes, as you can see below, bond investors started to migrate away from junk bonds toward more conservative (Treasuries)) well before stocks peaked. The credit markets correctly forecasted the coming risks in June 2007, or four months before a major bear market began in October.

2014: Credit Markets Have Been Concerned For Several Months
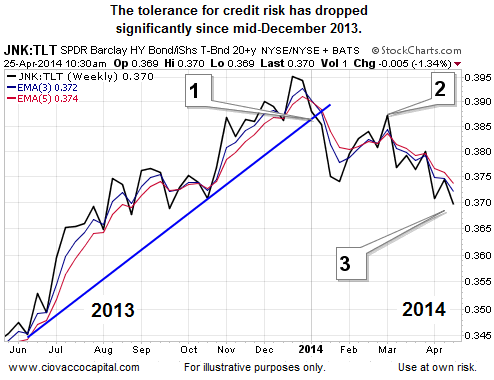
How does the ratio of junk bonds (JNK) vs. Treasuries look today? Answer - concerning for stocks and risk assets in general. The ratio has completed the three basic steps needed for a bearish trend change, which is not what stock market investors want to see.

2014 Similarities To 2007
Yellow flags start waving when we see phrases such as “borrowing money to pay dividends like it’s 2007″, and “obtained almost $21 billion in junk-rated loans this year to enrich their owners”. From Bloomberg:
Companies owned by private-equity firms are borrowing money to pay dividends like it’s 2007, adding to concern among regulators that excesses are emerging in the riskier parts of the debt markets. Borrowers including Madison Dearborn Partners LLC’s mobile-phone insurer Asurion LLC obtained almost $21 billion in junk-rated loans this year to enrich their owners, the most in seven years, according to Standard & Poor’s Capital IQ LCD. Some of the least-creditworthy companies are even selling notes that may pay interest with more debt, which BMC Software Inc. did for its $750 million payout to a group led by Bain Capital LLC.
Bonds Helped In 2011
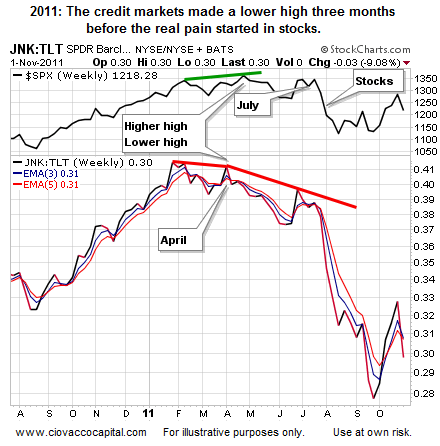
Are the credit markets always helpful in forecasting impending stock market weakness? No, but the track record is strong enough to be very helpful over longer periods of time. This video clip shows one example where the credit markets were weak and stocks held up well. Similar to 2007, the JNK:TLT ratio peaked in 2011 well before the European debt crisis assisted with a sharp decline in equities in July/August.

Investment Implications - Mixed Bag Calls For Diversification
Regular readers have grown tired of the terms “indecisive”, “low conviction”, and “tentative”. Regular readers also know we write articles and manage risk based on observable evidence. The evidence has been mixed and quite a bit more cautious than what was present in 2014.
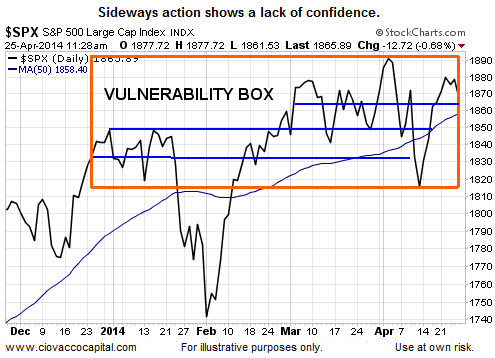
Has the observable evidence helped us in terms of reducing portfolio risk during a less attractive risk-reward period? The chart below showing the S&P 500 has gone next-to-nowhere in 2014 says the answer is “yes”.

Vulnerable And Bearish Are Not Synonyms
If we are biased, we can interpret “vulnerable” as “bearish”. Vulnerable does not mean bearish. Merriam-Webster’s defines vulnerable as “open to attack or damage.” The long-term bullish trends in stock and the economy remain intact. However, they are currently susceptible to “attack or damage”. How do we handle a bullish, but vulnerable, market? With an allocation of stocks (SPY), bonds (TLT), and cash. This mixed approach allows us to migrate in either direction (bullish or bearish) based on how things unfold.
Housing Partly To Blame
While there are countless inputs that go in the market’s pricing mechanism, one negative contribution is coming from the all-important housing sector. From CNBC:
Except in a few booming markets, housing is nowhere close to pulling its economic weight. Consider this: Investment in residential property remains a smaller share of the overall economy than at any time since World War II, contributing less to growth than it did even in previous steep downturns in the early 1980s, when mortgage rates hit 20 percent, or the early 1990s, when hundreds of mortgage lenders failed.
