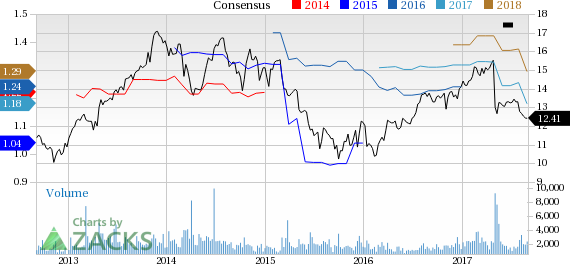
It has been about a month since the last earnings report for Hercules Capital, Inc. (NYSE:HTGC) . Shares have lost about 8.5% in that time frame, underperforming the market.
Will the recent negative trend continue leading up to the stock's next earnings release, or is it due for a breakout? Before we dive into how investors and analysts have reacted as of late, let's take a quick look at the most recent earnings report in order to get a better handle on the important catalysts.
Hercules Capital Q2 Earnings in Line, Revenues Rise
Hercules Capital’s second-quarter 2017 net investment income of $0.31 per share was in line with the Zacks Consensus Estimate. However, the figure reflected a fall of 3.1% from the year-ago quarter.
Results were adversely impacted by a rise in operating expenses. Further, a fall in net asset value was on the downside. However, an increase in revenues and growth in investment portfolio was impressive.
Distributional Net Operating Income for the quarter came in at $27.2 million or 33 cents per share compared with $25 million or 34 cents per share in the prior-year quarter.
Total Investment Income Improves, Expenses Rise
Total investment income in the reported quarter was $48.5 million, up 11.3% year over year. The increase is mainly driven by debt investment portfolio growth and a greater weighted average principal outstanding of the company's debt investment portfolio and a higher level of unscheduled early repayments. Also, the figure beat the Zacks Consensus Estimate of $48.2 million.
Total operating expenses rose 14.8% year over year to $23.2 million. The rise was largely led by an increase in interest and loan fees.
Total Portfolio Value & New Commitments
The fair value of Hercules Capital’s total investment portfolio was $1.40 billion as of Jun 30, 2017. In the reported quarter, the company provided approximately $206 million in new debt and equity-financing commitments to new and existing portfolio companies.
Balance Sheet
As of Jun 30, 2017, Hercules Capital’s net asset value was $9.87 per share compared with $9.90 as of Dec 31, 2016. The company had $355.4 million in liquidity, including $160.4 million in unrestricted cash and cash equivalents and $195 million in credit facilities as of Jun 30, 2017.
At the end of the second quarter, the weighted average cost of debt comprising interest and fees was 5.5%, down from 5.8% in the prior-year quarter. The fall was mainly due to the one-time, non-cash acceleration of unamortized fees due to the redemption of 2019 Notes and the new issuance and addition of convertible notes. Adjusted weighted average cost of borrowings was 4.76%.
How Have Estimates Been Moving Since Then?
Following the release, investors have witnessed a downward trend in fresh estimates. There have been four revisions lower for the current quarter. In the past month, the consensus estimate has shifted down by 8.1% due to these changes.
VGM Scores
At this time, the stock has an average Growth Score of C, however its Momentum is lagging a lot with an F. However, the stock was allocated a grade of D on the value side, putting it in the bottom 40% for this investment strategy.
Overall, the stock has an aggregate VGM Score of F. If you aren't focused on one strategy, this score is the one you should be interested in.
Our style scores indicate that the stock is solely suitable for growth investors.
Outlook
Estimates have been broadly trending downward for the stock. The magnitude of this revision also indicates a downward shift. Interestingly, the stock has a Zacks Rank #3 (Hold). We are looking for an inline return from the stock in the next few months.
Hercules Capital, Inc. (HTGC): Free Stock Analysis Report
Original post
Zacks Investment Research

