Founded in 1864, Heineken NV (AS:HEIO) is the largest brewer in Europe and the second largest in the world. Even though its original brewery in Amsterdam closed in 1988, the company still operates over 165 breweries in more than 70 countries around the globe.

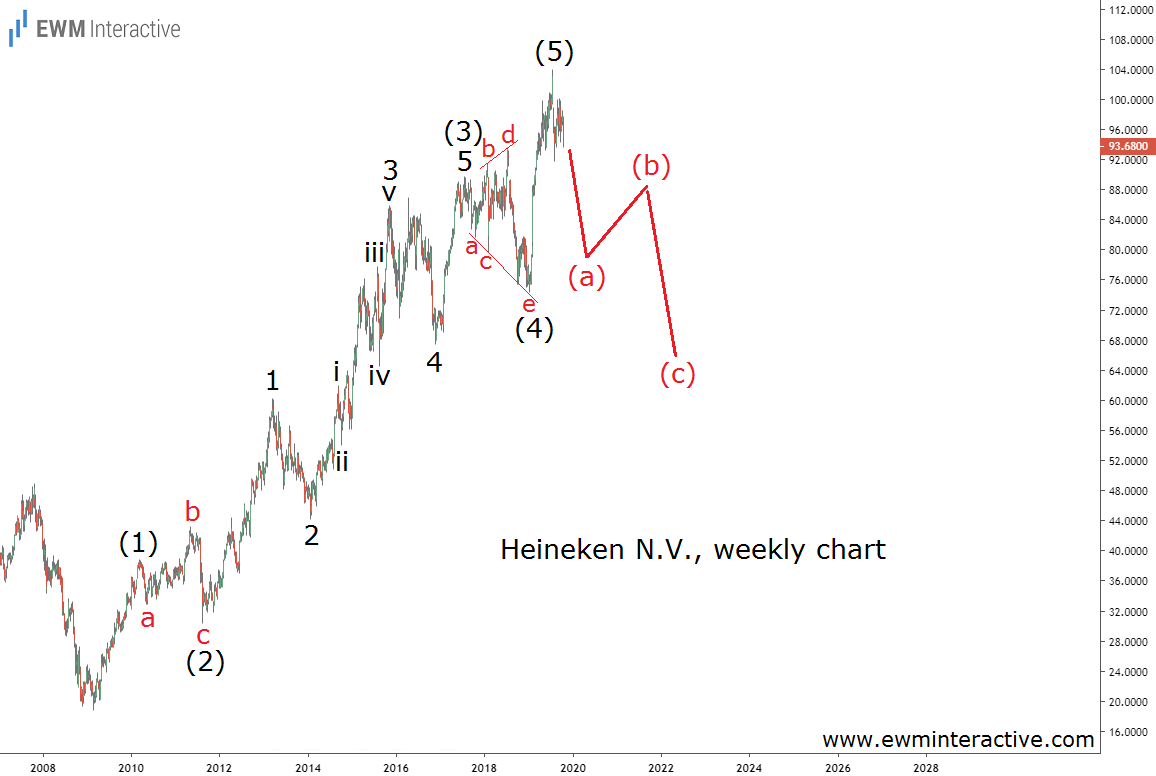
During the Financial Crisis, in March 2009, Heineken stock fell below 19 euro a share in Amsterdam. Ten and a half years later now, it sits comfortably above 93 after exceeding 100 in July. But can the bulls really afford to feel that comfortable? No trend lasts forever and the post-2009 recovery is already old enough. In order to find out what is left of it, let’s take a look at its structure through the prism of Elliott Wave analysis. Heineken’s weekly chart below will serve as our visual aid.
According to the theory, trends form five-wave structures called impulses. Every impulse is then followed by a three-wave correction in the opposite direction before the larger trend can resume. Unfortunately for the bulls, the chart above illustrates that Heineken stock has already drawn a complete impulse pattern.
It is labeled (1)-(2)-(3)-(4)-(5), where the sub-waves of wave (3) are also clearly visible. Wave (4) is interesting, because it is an expanding triangle correction – something we don’t see every day. If this count is correct, the high at 104 euro a share might turn out to be a major top. A three-wave decline can be expected to drag Heineken down to the support area of wave 4 of (3) near 70. The company can lose 25% in market value before it is worth the risk again.
