
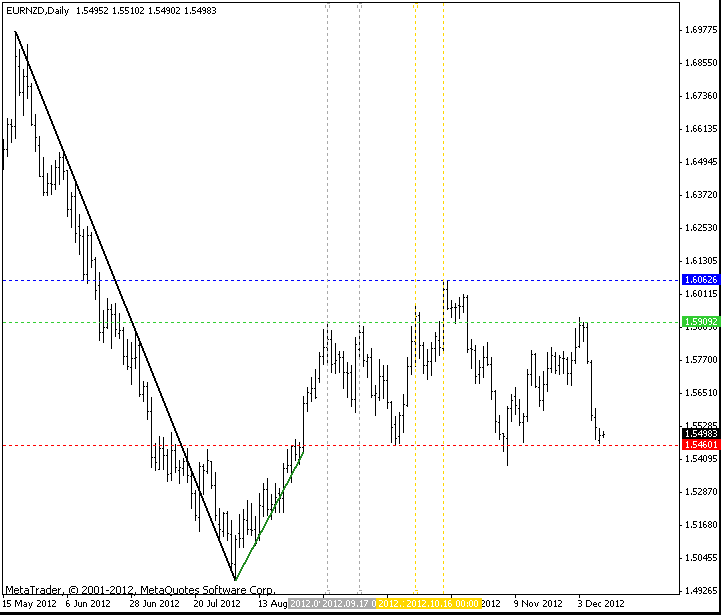
After failing a falling wedge pattern on its weekly time frame, the EUR/NZD currency pair is demonstrating an imperfect, yet noteworthy, head-and-shoulders pattern on its daily chart.
As can be seen on the image, the pattern is visible quite clearly. Yet it fails to meet all of the criteria for a high probability head-and-shoulders set-up.
The pattern begins on August 28 and thus contains 75 full trading daily sessions or about 15 weekly ones. Generally, it is a good sign for the H&S patterns. The shoulder line is marked with the green dashed line. The neckline is marked with red dashed line. The blue dashed line marks the top of the pattern's head.
 EUR/NZD D1 Head-and-Shoulders 2012-12-11" title="EUR/NZD D1 Head-and-Shoulders 2012-12-11" width="721" height="615">
Its main problem is that it is not ending the uptrend. Of course, that is if you do not count the relatively small bullish wave that lasted from August 3 till August 28 (marked by a bold green line) as an uptrend worth reversing by such a huge chart formation. The long-term trend direction is clearly bearish, which is confirmed by the preceding downmove lasting for two and a half months (marked with bold black line).
Another problem is contained within its double peaks. Normally, you would expect the head and both shoulders to have one price peak each. In this case, we have two nearly identical tops inside the left shoulder (dashed gray lines on September 5 and 17) and less similar, but still noticeable, peaks inside the head (dashed yellow lines on October 5 and 16).
The third warning sign is given by an uneven neckline composition - EUR/NZD managed to break it during November 6 and stay there for a while a day after.
Still, the present chart pattern remains tradable. However, you would want to consider a lower risk size per position when dealing with something so distant from a model head-and-shoulders figure.
A breakout below the neckline level (1.5460) would be a good shorting opportunity. However, placing your sell orders closer to the previous breakout's low (1.5385) would lessen your chances of getting into a fakeout trade. Long entry should not be considered seriously with this set-up.
- English (UK)
- English (India)
- English (Canada)
- English (Australia)
- English (South Africa)
- English (Philippines)
- English (Nigeria)
- Deutsch
- Español (España)
- Español (México)
- Français
- Italiano
- Nederlands
- Português (Portugal)
- Polski
- Português (Brasil)
- Русский
- Türkçe
- العربية
- Ελληνικά
- Svenska
- Suomi
- עברית
- 日本語
- 한국어
- 简体中文
- 繁體中文
- Bahasa Indonesia
- Bahasa Melayu
- ไทย
- Tiếng Việt
- हिंदी
Head-And-Shoulders On EUR/NZD Daily Chart
Published 12/11/2012, 05:02 AM
Updated 07/09/2023, 06:32 AM
Head-And-Shoulders On EUR/NZD Daily Chart
Latest comments
Loading next article…
Install Our App
Risk Disclosure: Trading in financial instruments and/or cryptocurrencies involves high risks including the risk of losing some, or all, of your investment amount, and may not be suitable for all investors. Prices of cryptocurrencies are extremely volatile and may be affected by external factors such as financial, regulatory or political events. Trading on margin increases the financial risks.
Before deciding to trade in financial instrument or cryptocurrencies you should be fully informed of the risks and costs associated with trading the financial markets, carefully consider your investment objectives, level of experience, and risk appetite, and seek professional advice where needed.
Fusion Media would like to remind you that the data contained in this website is not necessarily real-time nor accurate. The data and prices on the website are not necessarily provided by any market or exchange, but may be provided by market makers, and so prices may not be accurate and may differ from the actual price at any given market, meaning prices are indicative and not appropriate for trading purposes. Fusion Media and any provider of the data contained in this website will not accept liability for any loss or damage as a result of your trading, or your reliance on the information contained within this website.
It is prohibited to use, store, reproduce, display, modify, transmit or distribute the data contained in this website without the explicit prior written permission of Fusion Media and/or the data provider. All intellectual property rights are reserved by the providers and/or the exchange providing the data contained in this website.
Fusion Media may be compensated by the advertisers that appear on the website, based on your interaction with the advertisements or advertisers.
© 2007-2025 - Fusion Media Limited. All Rights Reserved.