HCA Holdings, Inc (HCA) is a non-governmental hospital operator in the United States and an integrated provider of health care and related services.
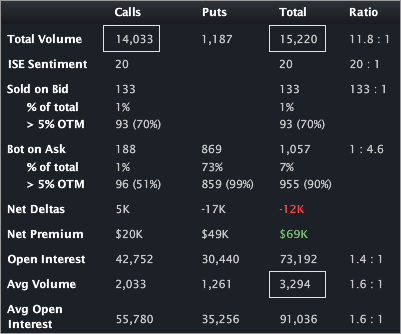
This is an order flow note and an apparent "mistake" from the OCC on the reported OI. Let's start simple and move to the "error" in a bit. HCA has traded over 15,000 contracts today on total daily average option volume of just 3,294. Calls have traded on an 11.8:1 ratio to puts with the action in the Feb 22.5 calls. Nearly 14,000 of those Feb 22.5's have traded today. The color I got was customer buying outright. The Stats Tab and Day's biggest trades snapshots are included (below).


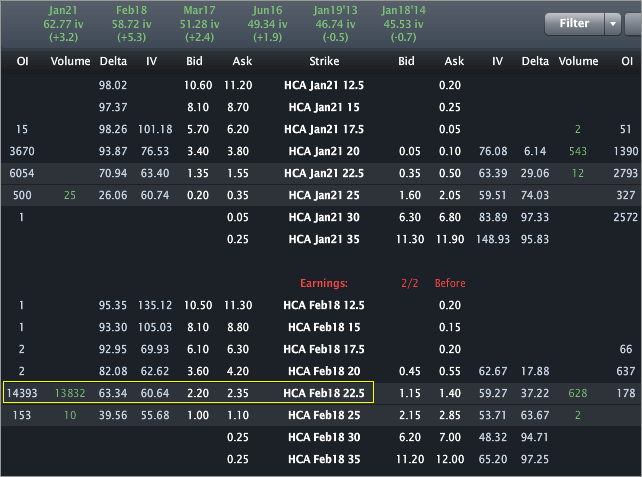
The Options Tab (below) illustrates that the calls already show an existing OI of 14,393. Looking to the level II data from Livevol® Pro, we can see that OI jumped from ~800 to the current level today. So, that means that ~13,000 of those calls (at least) traded yesterday. Here's the error -- there were not trades yesterday in that line of that size (or in aggregate). It looks like the trade was put up yesterday, then perhaps cancelled or busted later. But, nonetheless, the OI showed the change. Today, the trader seems to have finally gotten the trade on successfully. This is an unusual phenomenon where the normally pristine OI numbers reported by the OCC are in fact misleading.
In any case, the actual OI of about 14,000 is quite large for this company -- and note that earnings are due out in the Feb options cycle. This feels like a spec bet on earnings, perhaps.

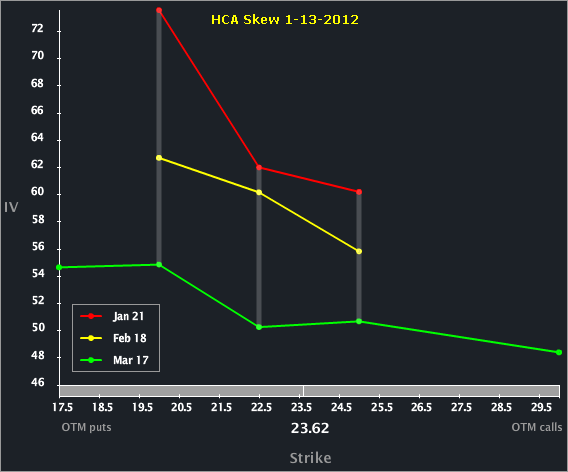
The Skew Tab snap (below) illustrates the vols by strike by month.

We can see the vol moves up to the shorter expiries monotonically. The rather large vol diff between Feb and Mar is likely a reflection of an earnings "event" in early Feb. All three of the front expiries show a normal(ish) skew shape.
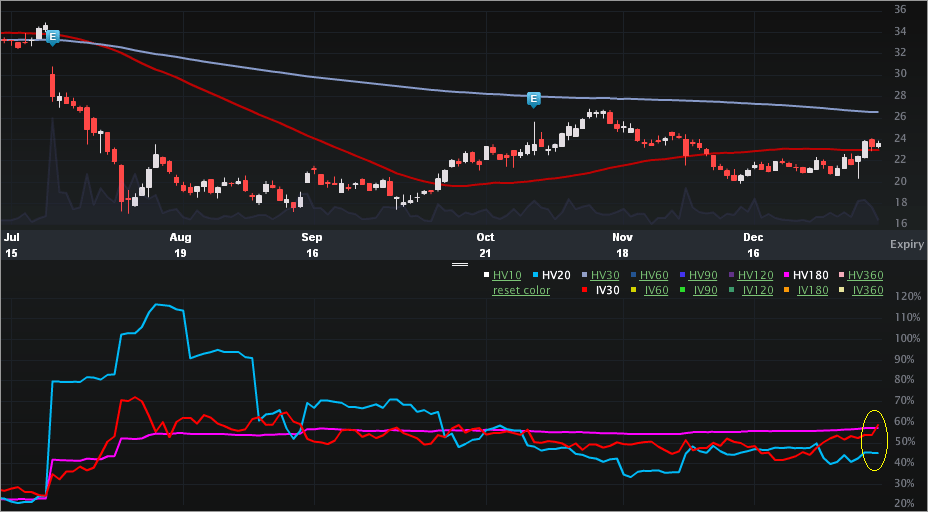
Finally, the Charts Tab (6 months) is below. The top portion is the stock price, the bottom is the vol (IV30™ - red vs HV20 - blue vs HV180 - pink).

Note on the left side of the stock portion, the gap down in stock price of the earnings release in Jul. The stock was trading ~$35 and less than a month later it was a teenager -- so ~50% drop in a month. It's interesting to note that the implied tends to trade below the short-term historical realized vol (HV20). In English, the short-term (future) risk reflected by the implied vol tends to be lower than the actual stock movement (in the short-term). The vega buyer today in Feb may be a bet that the trend continues and rather significantly off of an earnings move.
This is trade analysis, not a recommendation.
This is an order flow note and an apparent "mistake" from the OCC on the reported OI. Let's start simple and move to the "error" in a bit. HCA has traded over 15,000 contracts today on total daily average option volume of just 3,294. Calls have traded on an 11.8:1 ratio to puts with the action in the Feb 22.5 calls. Nearly 14,000 of those Feb 22.5's have traded today. The color I got was customer buying outright. The Stats Tab and Day's biggest trades snapshots are included (below).


The Options Tab (below) illustrates that the calls already show an existing OI of 14,393. Looking to the level II data from Livevol® Pro, we can see that OI jumped from ~800 to the current level today. So, that means that ~13,000 of those calls (at least) traded yesterday. Here's the error -- there were not trades yesterday in that line of that size (or in aggregate). It looks like the trade was put up yesterday, then perhaps cancelled or busted later. But, nonetheless, the OI showed the change. Today, the trader seems to have finally gotten the trade on successfully. This is an unusual phenomenon where the normally pristine OI numbers reported by the OCC are in fact misleading.
In any case, the actual OI of about 14,000 is quite large for this company -- and note that earnings are due out in the Feb options cycle. This feels like a spec bet on earnings, perhaps.

The Skew Tab snap (below) illustrates the vols by strike by month.

We can see the vol moves up to the shorter expiries monotonically. The rather large vol diff between Feb and Mar is likely a reflection of an earnings "event" in early Feb. All three of the front expiries show a normal(ish) skew shape.
Finally, the Charts Tab (6 months) is below. The top portion is the stock price, the bottom is the vol (IV30™ - red vs HV20 - blue vs HV180 - pink).

Note on the left side of the stock portion, the gap down in stock price of the earnings release in Jul. The stock was trading ~$35 and less than a month later it was a teenager -- so ~50% drop in a month. It's interesting to note that the implied tends to trade below the short-term historical realized vol (HV20). In English, the short-term (future) risk reflected by the implied vol tends to be lower than the actual stock movement (in the short-term). The vega buyer today in Feb may be a bet that the trend continues and rather significantly off of an earnings move.
This is trade analysis, not a recommendation.
