Investing.com’s stocks of the week
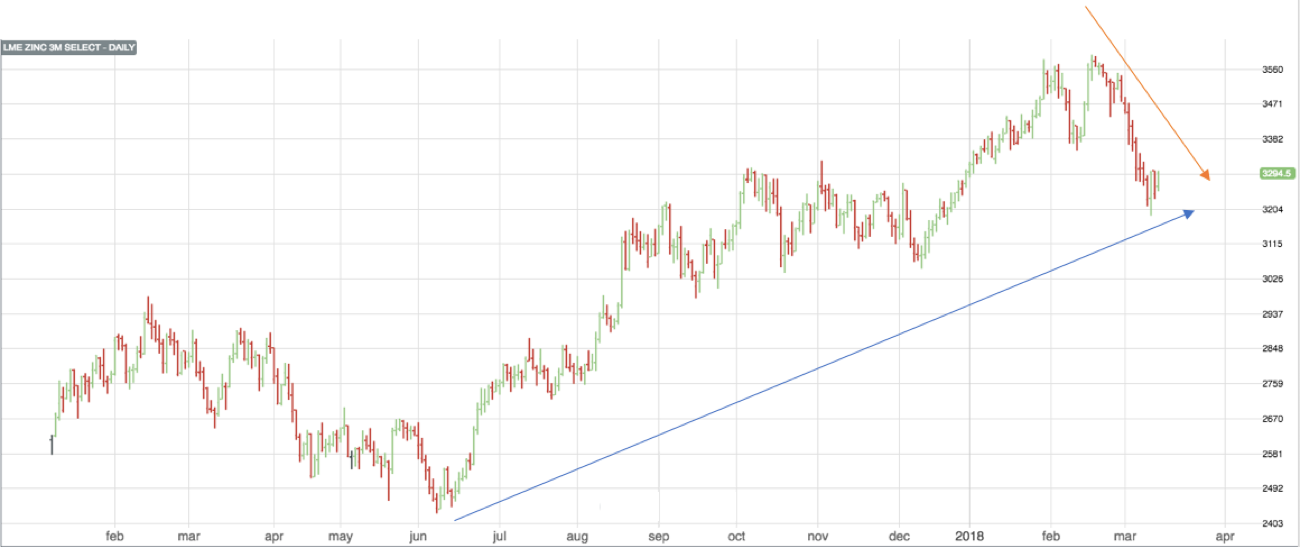
This month, zinc prices started to trade lower, returning to the $3,200 level. This activity represents the first short-term price pullback we’ve seen in zinc prices since June 2017, when prices started their latest rally.

Source: MetalMiner analysis of FastMarkets
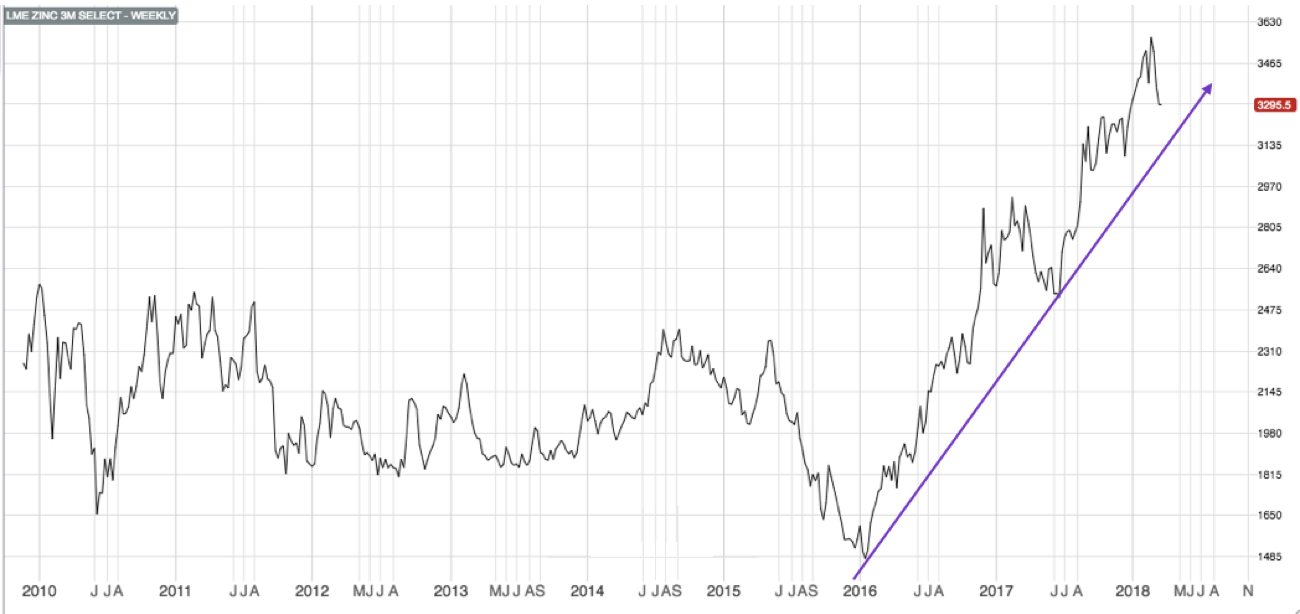
But going back even further, the zinc price bullish rally started in 2016. Since then, zinc prices have increased around 120%, from $1,471/mt to current levels.
During this bullish rally, zinc prices reached a more than 10-year high, which signaled strength in the rally.

Source: MetalMiner analysis of FastMarkets
Some analysts believe this recent short-term downtrend serves as a possible peak for zinc prices. In other words, zinc prices may have already peaked and have started a new downtrend.
The alarms sounded on the London Metal Exchange when 78,950 tons of metal were delivered into LME stocks.
Before we speculate as to where zinc prices are going, let’s examine some of the indicators.
LME Stocks vs. Trading Volume
Traders commonly react to stocks changes, which is reflected directly in zinc prices. When a big delivery of any metal — in this case, zinc — reaches the LME stock, traders interpret this signal as a lack of tightness in the metal supply and demand equation.
In other words, traders think that the deficit is lower and sell their positions for the metal.
However, LME stock levels typically serve as a very short-term price driver (for days or weeks, not months). Rather, MetalMiner believes trading volumes better reflect the metal price trend. Zinc trading volume still supports the long-term uptrend, even if prices have so far trended lower this month.
Global Zinc Market
According to the International Lead and Zinc Study Group (ILZSG), 2017 left behind a deficit of 495 kt for refined zinc metal. Zinc mine output increased by 33.7% in India, while the increase in Peru was driven by higher output in the Antamina mine.
World output refined zinc production remained flat when compared to 2016, with increases in India around 30.4% versus a decrease in Canada, China, Peru and the Republic of Korea.
Despite the increases in zinc production, zinc demand increased by 2.6%, driven by zinc appetite in Australia, Brazil, China and Japan.
U.S. demand increased by just 0.6%, while European demand fell 0.5%.
Chinese Zinc Market
As for other industrial metals, Chinese numbers are commonly used as an indicator for the global metal industry. During the November 2017 to January 2018 period, China’s official zinc trade figures show 291,000 tons of refined zinc entering the country. This figure is the largest since 2009, when metallic trade flows were massive.
Shanghai Futures Exchange (ShFE) zinc stocks have recovered from a 2017 drop of 84,000 tons. Since the beginning of 2018, zinc stocks have rebounded by 46,000 tons, reaching the highest level since May 2017 (114,887 tons).
Brazilian Zinc
Brazilian mine Nexa Resources forecasts a deficit for zinc in 2018, with demand outpacing supply.
The deficit may continue due to the inability of Chinese small mines to renew permits under current environmental policies. Therefore, Chinese production may not be able to meet the annual demand growth of around 2-2.5% (based on previous growth).
What This Means for Industrial Buyers
MetalMiner sees the current pullback in zinc prices as short-term in nature as opposed to a price trend correction.
Therefore, while base metals and zinc remain in a current bull market, buying organizations may want to take advantage of lower prices and learn the exact time to commit to some zinc volume.
