Stocks reached out for new 2020 highs yesterday, and have marginally overcome futures’ Monday session highs. Yet, they suffered a setback yesterday, and price action left the very short-term rising wedge. But the bulls erased a good deal of previous losses, and are again reaching higher. What does it mean for the short-term outlook?

charts courtesy of stockcharts.com
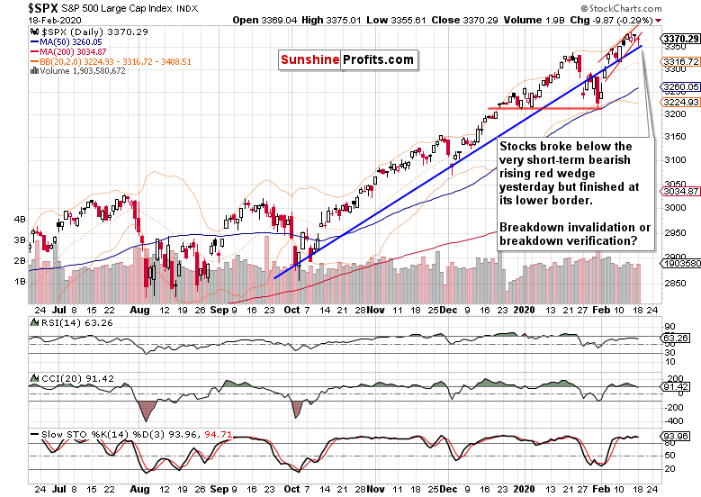
The first thing that strikes the eye, is that yesterday’s price action took place outside of the very short-term rising red wedge. While there’s no major difference between the opening and closing prices, this is significant. Short-term significant, to be precise.
As we’ve just met a very similar candle in oil, let’s quote from our yesterday’s Oil Trading Alert. It’s relevant for stocks as well because it strongly reminds of the candlestick seen earlier – it’s called hanging man, and it has bearish implications:
(…) This candlestick pattern is created as a result of higher market opening, which turns out to be too high. The sellers in such cases take the initiative and push the price down. The buyers, however, pull it up with the last of their strength, and a candle’s small body is the result, just as yesterday. Additionally, the candle features a long lower shadow – the longer, the better. It suggests that declines may be just around the corner.
At this point, it is worth keeping in mind that this is a single-candle formation, so it requires confirmation. (…) If the market opens lower right after the mentioned hanging man, it creates a bearish gap. Then, it may turn out that there are too many bulls with long positions who would be looking for selling opportunities.
If you look carefully, Monday’s price action fits the above description quite well. Not outrageously high, but a higher open still – and followed by a lower knot. And stocks opened with a bearish gap yesterday, only to drop significantly lower before paring their losses before the closing bell.
While stock futures are pointing up to open at over 3778 today, we are of the opinion that this is a reasonable moment to put up our guards and in the interest of the risk-reward perspective, to close the currently profitable open long position.
Why exactly?
There is a creeping deterioration in the daily indicators, with the CCI on the verge of issuing its sell signal. The indicators can only be extended for so long before getting aligned with the price action. And the very short-term risks have shifted to the downside.
Should we treat yesterday’s close practically at the lower border of the rising red wedge as breakdown invalidation or breakdown verification? In our opinion, it should be preliminarily treated as breakdown verification as prices haven’t really rallied back into the wedge. They just bounced from the first line of support we’ve identified yesterday – the rising blue support line.
Sure, the breakdown isn’t verified by several consecutive closes yet. But the volume comparison indicates increasing interest of the bears and another and more committed attempt to drive prices lower is probable to happen soon.
Does it change the medium-term outlook? No, there’s no chart damage to speak of. Let’s recall our yesterday’s observations regarding the weekly outlook:
(…) Stocks built on last weeks’ gains, and keep trading farther and farther away from the upper border of the rising purple trend channel. While weekly volume doesn’t flash any warning signs of an impending reversal, what about the other indicators?
Both the RSI and CCI are back into overbought territory, and their brief dips that flashed sell signals have been invalidated. Acting on Stochastics’ sell signal generated in its overbought area would indeed lead to a whipsaw. In short, the weekly indicators continue to comprehensively support the bulls.
And what about our yesterday’s notes on market breadth:
(…) The decline in both the advance-decline line and the advance-decline volume spells a short-term deterioration, yet new highs minus new lows keep moving higher. This constellation points to stocks undergoing a soft patch that isn’t (yet?) reflected in prices. Why is the yet with a question mark? It’s because this might be all there is for the soft patch, and all the earlier mentioned signs of caution may as well get worked out by a shallow correction and a continuing slow grind higher.
Remember, the bullish percent index solidly above 50% and not in a recent downtrend, shows prevailing buying interest – in other words, upswing confirmation and the bull market is the valid conclusion here.
It must be said, we’ve seen a short-term deterioration in all of them apart from new highs minus new lows.
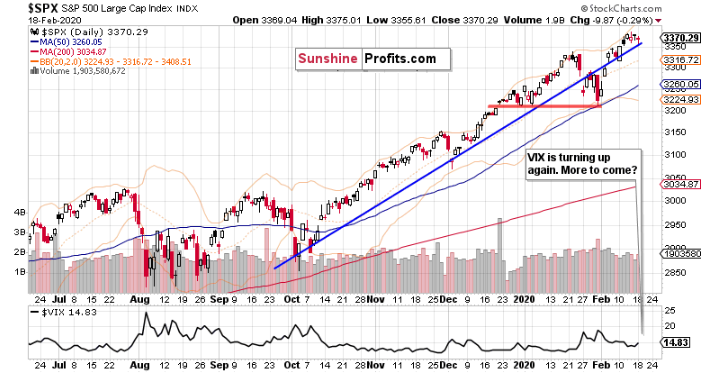
There’s one more reason for short-term caution. The VIX, the volatility measure. During the recent upswing, it turned predictably lower. Yesterday’s action means it’s turning up – and it would turn up more should prices not erase their earlier losses before the closing bell.

Summing up, the medium-term S&P 500 outlook remains solidly bullish, yet we see noticeable signs of deterioration on the daily chart. While the upswing continuation is favored in the medium term, we expect more downside action and shortly. Therefore, we’re taking profits off the table, and let the likely deterioration in short-term prices play out without hurting our bottom line. Once justified by the risk-reward perspective, we’ll get back on the long side, as the stock bull market remains intact and much higher prices are to come. Our aim is to let the many bullish factors in this stock bull market keep working to our benefit – but the risk of short-term downside got right now too high to ignore.
