In today’s post I want to talk a little about how support and resistance is not always a price level.
Every trading textbook would have you believe that support is a price level at which investors want to buy in because previously this is a point where a stock found buyers. There’s a few other scenarios to help define support as a price level but I don’t want to waste both of our time on that.
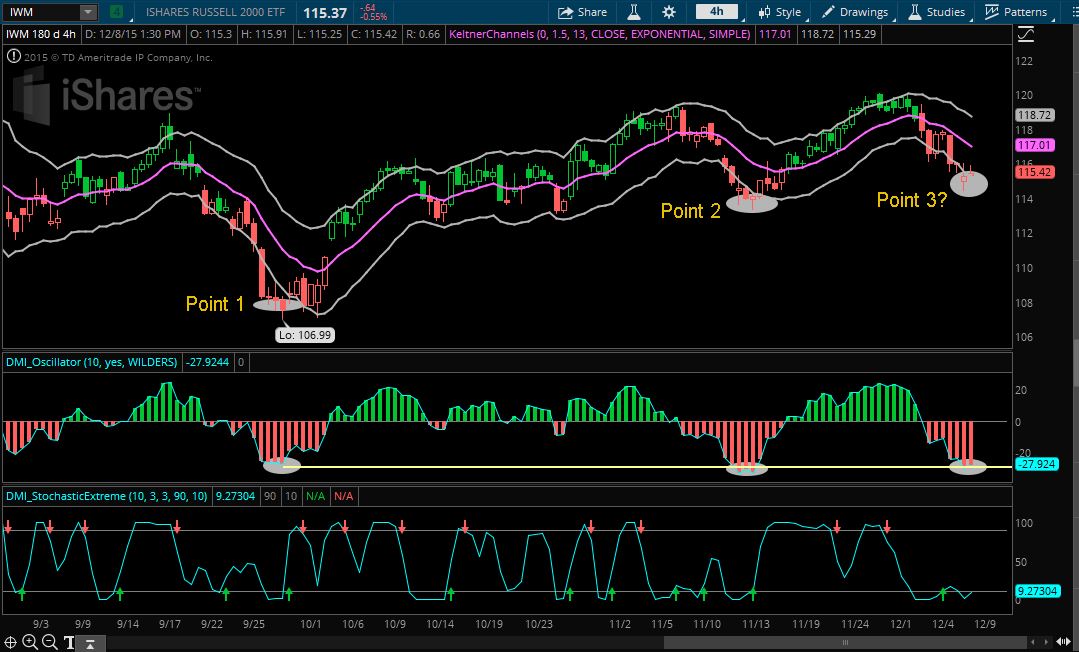
What I want to show you is how support can also be a level when sellers get tired, regardless of the price level. The example we’re going to look at in the chart below is with the Russell 2000 ETF, ticker N:IWM.
Support doesn’t have to be a price level…
The way I like to measure the fortitude of buyers and sellers is with the Directional Movement Index using the DMI Oscillator. The DMI Oscillator measures the distance between the DI+ and DI- lines that make up the Directional Movement Index.
If a stock or ETF goes too far in any one direction, eventually buyers or sellers start to take profits and cover their position. In the case of the IWM on the 4 hour chart (my favorite time frame by the way), a level of about -30 on the DMI Oscillator has been about the point of seller exhaustion.
The previous two times we reached this level, we chopped around for a few candlesticks and then the buyers stepped in. What you’ll notice though is that the last two times this happened, the price levels were much different. At Point 1 the low was around 107 and Point 2 the low was around 114. So very similar seller exhaustion readings yet different price levels.
So what I’ll be looking for tomorrow is some movement to the upside on both the DMI Oscillator and DMI StochasticExtreme for a trade entry. I’m currently stalking some IWM JAN Delta 70 Call Options for a swing trade.

