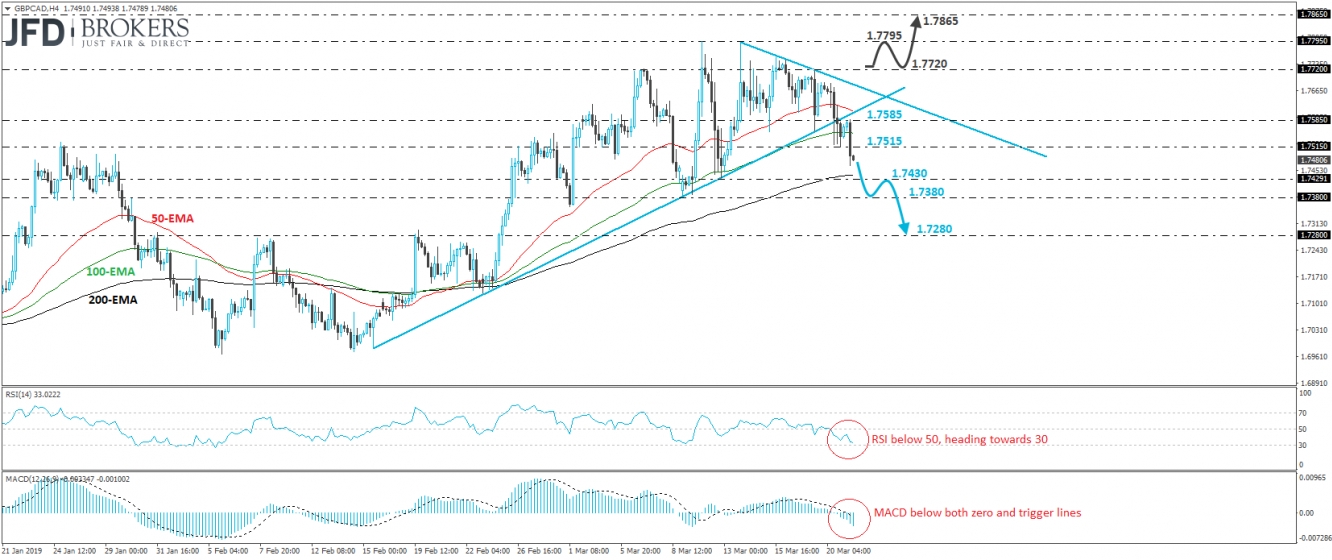
GBP/CAD traded lower during the European morning Thursday, breaking below the support (now turned into resistance) line of 1.7515 defined by yesterday’s low. Yesterday, already trading below a downside line drawn from the peak of March 13th, the pair slid below the short-term uptrend line taken from the low of February 15th. Combined with today’s slide below 1.7515, this paints a negative near-term picture in our view.
If the bears are willing to stay in the driver’s seat, we would expect them to aim for the 1.7430 zone soon, marked by the low of March 12th. A dip below that level could initially pave the way towards the low of March 10th, at around 1.7380, the break of which could carry larger bearish implications, perhaps allowing the bears to put the 1.7280 area on their radar. That zone acted as a decent resistance from January 31st until February 25th when it was broken to the upside.
Turning our gaze to the short-term oscillators, we see that the RSI, already below 50, turned back down and now looks to be heading towards 30, while the MACD lies below both its zero and trigger lines, pointing south as well. These indicators detect downside speed and corroborate our view for some further near-term declines in GBP/CAD.
On the upside, we would like to see a clear move above Tuesday’s high, at around 1.7720, before we start examining whether the bears have abandoned the battlefield. Such a move would bring the rate above both the aforementioned diagonal lines and may see scope for extensions towards the 1.7795 level, marked by the highs of March 11th and 13th. That said, a break above that hurdle may be needed to signal that the bulls have taken full control, as it would confirm a forthcoming higher high on both the 4-hour and daily charts. The next resistance zone we may see being tested thereafter is near 1.7865, defined by the inside swing lows of April 24th, 25th and 26th.

