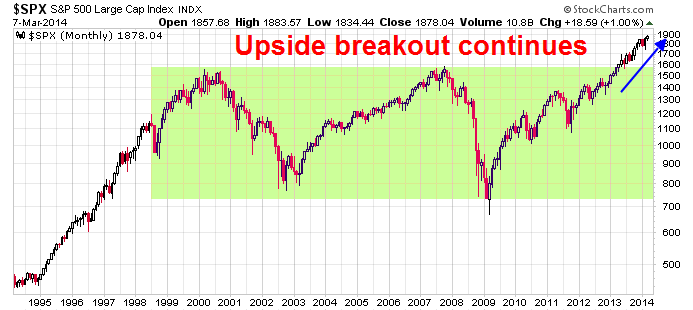
Five years after the market bottom in 2009 (also see my cautiously bullish Phoenix rising? post from February 24, 2009), the SPX rallied to new all-time highs last week. Last year, this index decisively staged an upside breakout from a trading range that stretches back to the NASDAQ top in 2000.
Here's a key long-term market question. Is it time for the secular bear camp to throw in the towel and call this stock market a new secular bull?
Elevated valuation
The technical evidence is certainly there, but my inner fundamental investor remains conflicted because valuations are elevated. Doug Ramsey of Leuthold Weeden Capital Management recently penned an article on this very topic showing his (and my) certainty. First of all, Ramsey wrote that some analysts consider the 666 low on the SPX to be low enough for a secular bear low compared to market history:
A handful of analysts have contended the March 2009 low was not secular in nature—although their ranks thinned considerably in 2013. They claim the 2000-09 decline was simply too short to sufficiently purge the excesses built up during history’s most powerful secular bull. They have a point: The four previous secular bears lasted from 12 to 17 years even though all four commenced from far less inflated valuations than those recorded at the 2000 peak.
Similarly, the remaining secular bears argue that U.S. stock market valuations never sank to levels befitting a true secular buying point. That’s debatable. At the intraday low of March 6, 2009 (the infamous “666”), the SP 500 traded at just 10.1x our 5-yr. Normalized EPS estimate—only half a point above the median P/E of 9.6x seen at the last four secular bear market lows. Close enough for government work, in our view. On the other hand, the SP 500 dividend yield at that historic low amounted to just half the median of 6.7% seen at the prior four lows.
He went on to qualify those valuations on the basis of the low interest rate regime:
We expect that the March 2009 levels reached by essentially all of our key U.S. valuation measures will prove to be lasting secular lows. In the context of zero interest rates and (at the time) zero inflation, it was probably unreasonable to expect valuations to match those seen in conjunction with the double-digit interest rates and inflation at the 1982 low.
Ramsey expressed his concerns about current valuation levels:
Our concern is not with the troughs of 2009, but where those valuations stand a mere five years into the supposed secular upswing. Even the P/E on forward EPS—though not a serious valuation tool—has returned to its late 2007 highs, and those measures with actual predictive ability don’t look any better.
All six of the accompanying valuation ratios are strongly (and negatively) correlated with subsequent 10-year stock returns, and the least extreme among them (the SP 500 12-Mo. Trailing P/E) still stands higher than about three-quarters of its history—with those earnings lifted by margins higher than 100% of their history. Three measures (Price/Cash Flow, Price-to-Book, and Price/Dividend) have moved into their ninth historical decile, and the SP Industrials Price/Sales ratio is now on a path into late-1990s bubble territory.
Whither corporate margins?
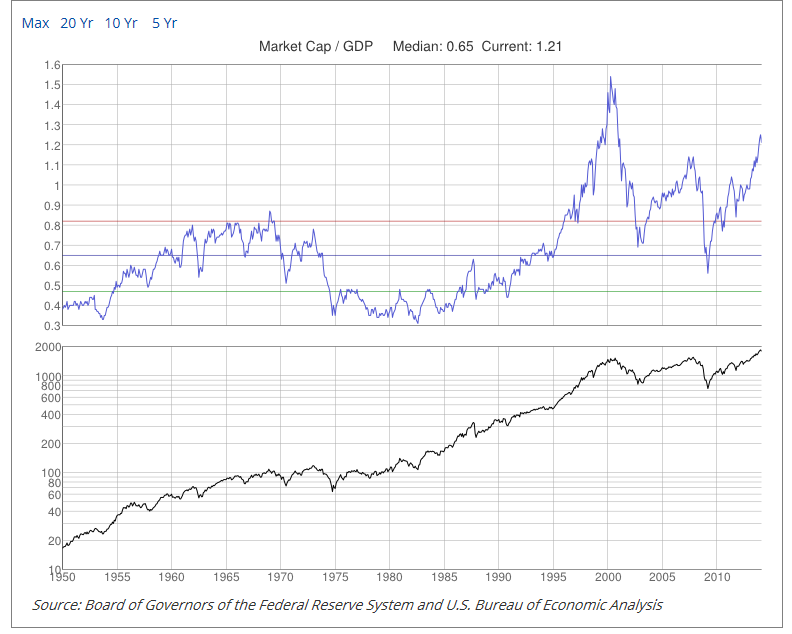
I feel Ramsey's pain. Secular bulls don't tend to launch themselves with valuations at elevated levels like these. Consider, for example, the market cap to GDP metric as a proxy for the Price to Sales ratio. This metric remains elevated and has surpassed its pre-Lehman Crisis highs:
The ratio today is 115.1% of the $16 trillion GDP. In the year 2000, just before the market cracked in the dot-com bubble, the market capitalization was 183% times the GDP, according to a chart published recently.
And in 2007, just as the housing credit bubble was bursting, the ratio was 135% times the GDP. These are all times when the stock market looks overvalued.
Then, the buying point for stocks was reached in March 2009 when the ratio of market cap to GDP was only 73%. The numbers were somewhat different in 1929 when the market cap already was in decline and amounted to 81% of GDP, but fell precipitously to 25% of a ruinous GDP in 1933.
By comparison, in the bear market of 1975 the ratio of stock valuation to GDP was 75%, definitely a buy signal if you were Berkshire Hathaway. Even a better opportunity was 2009 when the ratio of stock valuation to the economy fell to 50%. It was shooting ducks in a barrel and Buffett said so publicly several times.
Much of the secular bull and bear debate based on the market cap to GDP ratio revolves around why corporate net margins are so high. Recall that P/E = P/(Sales X Net Margin). For a full discussion see my previous post He who solves this puzzle shall be King.
Jesse Felder (via Business Insider) highlighted a warning that Warren Buffett made about corporate margins in 1999:
"In my opinion, you have to be wildly optimistic to believe that corporate profits as a percent of GDP can, for any sustained period, hold much above 6%. One thing keeping the percentage down will be competition, which is alive and well. In addition, there's a public-policy point: If corporate investors, in aggregate, are going to eat an ever-growing portion of the American economic pie, some other group will have to settle for a smaller portion. That would justifiably raise political problems—and in my view a major reslicing of the pie just isn't going to happen."
-Warren Buffett
Here is a difficult question for those in the secular bear camp. Buffett made those comments in 1999. Why has he said nothing since then about corporate margins? His silence on this issue has been deafening.
New secular bull = New stock market bubble?
Here is a difficult question for those in the secular bull camp. What's the upside from here? Ramsey of Leuthold Weeden Capital Management projects limited upside under a secular bull scenario, even assuming that everything goes right:
If the current cyclical bull unfolds into a secular one that is perfectly average in duration and magnitude (a very tall achievement, in our book), the annualized total return over the next ten years will still be a bit below the long-term average return of 10%. Frankly, we don’t find this all that compelling, considering all that must go according to plan for the market to achieve it (i.e. sustained EPS growth at a healthy 6% and an inflated terminal P/E multiple).
He added some of these gains depends on assuming the resumption of a stock market bubble:
Based on the relative positions of these time-tested measures, secular bulls seem to be implicitly betting on the reflation of a multi-generational stock bubble less than 15 years after it popped. The pathology of “busted bubbles”—which we’ve detailed at length in the past—doesn’t support that bet.
A cyclical bull, a secular ????
When he puts it all together, my inner investor thinks that, if we are indeed seeing a new secular bull market, the extraordinary measures undertaken by global central banks in the wake of the Lehman Crisis have front-end loaded many of the gains to be realized in this bull. There is, however, a silver lining to this outlook.
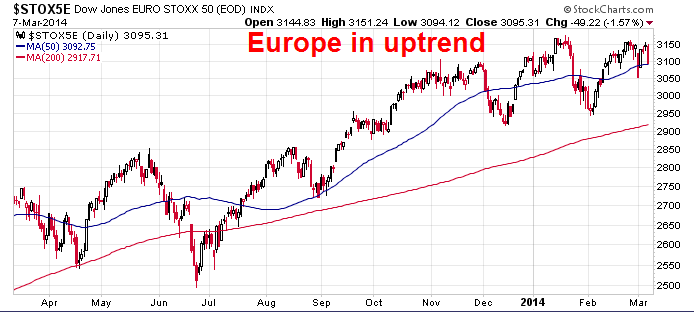
In the meantime, we are in the midst of a global cyclical bull, so enjoy it. I can point to the many positives highlighted by Jeff Miller in his latest weekly commentary, such as improving eurozone PMIs, the ISM beat last week, improving employment, etc.
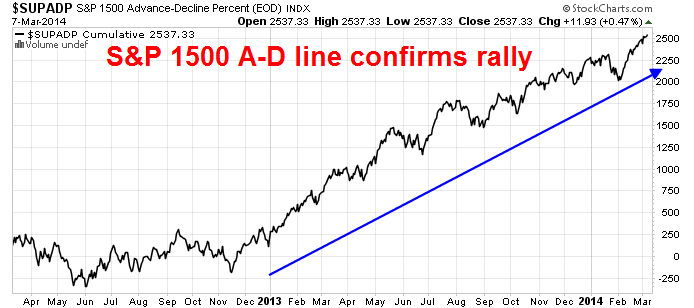
From a technical standpoint, continued strength in breadth indicators such as the Advance-Decline Line has confirmed last week's new high in US equities (see my commentary on breadth analysis in What bad breadth?):
Disclosure: Cam Hui is a portfolio manager at Qwest Investment Fund Management Ltd. (“Qwest”). The opinions and any recommendations expressed in the blog are those of the author and do not reflect the opinions and recommendations of Qwest. Qwest reviews Mr. Hui’s blog to ensure it is connected with Mr. Hui’s obligation to deal fairly, honestly and in good faith with the blog’s readers.”
None of the information or opinions expressed in this blog constitutes a solicitation for the purchase or sale of any security or other instrument. Nothing in this blog constitutes investment advice and any recommendations that may be contained herein have not been based upon a consideration of the investment objectives, financial situation or particular needs of any specific recipient. Any purchase or sale activity in any securities or other instrument should be based upon your own analysis and conclusions. Past performance is not indicative of future results. Either Qwest or I may hold or control long or short positions in the securities or instruments mentioned.

