Key Points:
- Long-term wedge and trend line remain in place.
- Recent tumble appears to have slowed.
- RSI and Stochastics are currently in oversold territory.
The cable could be taking a breather from its historic tumble as the pair looks to have finally found a modicum of support. Currently, it looks as though this support is being largely supplied by the long-term trend line, however, other technical indicators are also signaling that a brief pause is more than likely as the week winds down.
As for the long-term forecast, after this pause, the cable could either seek out fresh lows or even experience a breakout to the upside so it should be worth watching.
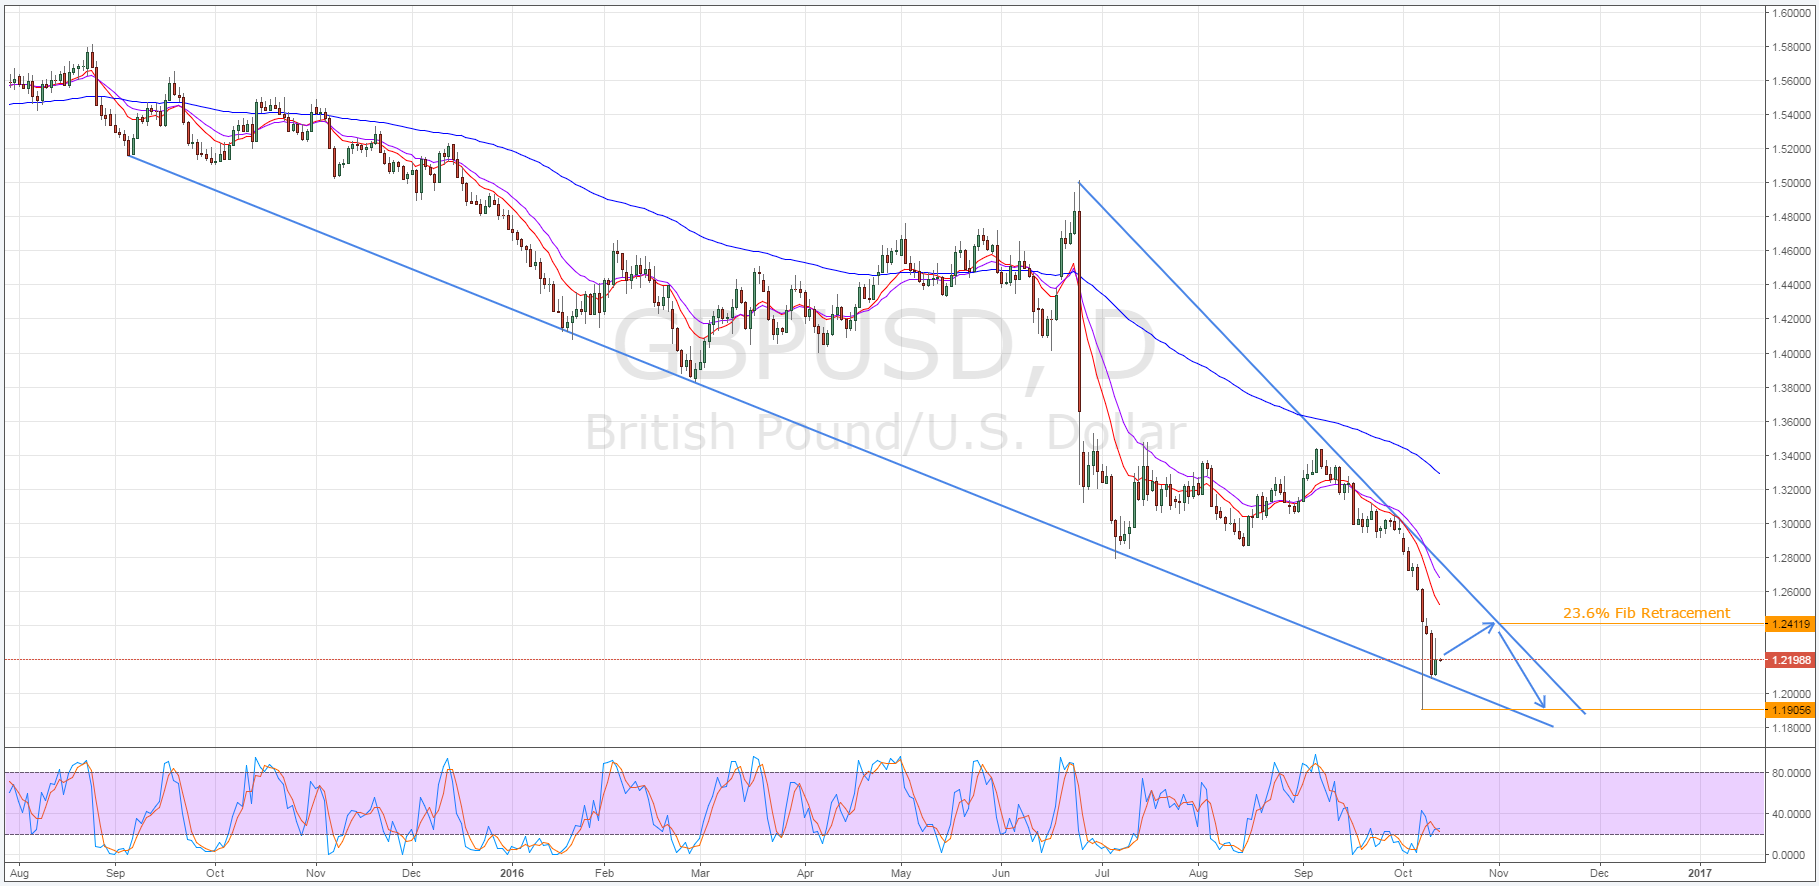
Firstly, as is evident on the daily chart, the cable’s recent and precipitous plunge has brought the pair into contact with the downside constraint of a tight falling wedge structure.
Interestingly, this constraint coincides with the long-term trend line which has dominated the GBP’s charts over the past year. As a result of this coincidence, support along the trend line should prove to be relatively robust moving forward which will cap some of the downside risks.

In addition to the wedge structure, support is currently being supplied by both stochastics and RSI readings. Due to these indicators moving into oversold territory, we expect to see a brief period of recovery for the cable before any further bearishness is experienced.
Specifically, the pair could move back to around the 1.2411 mark which represents the 23.6% Fibonacci retracement of the recent plunge. Furthermore, the pound should be fairly reluctant to move far beyond this price as that would entail breaching the upside of the falling wedge structure at its forecasted trajectory.
Despite the probable near-term bullishness, the medium to long-term forecast remains bearish for the GBP/USD. In fact, it’s expected that after its brief recovery, the pair will move back into decline and seek out fresh lows.
However, just how low it can travel is still up for debate and HSBC currently forecasts the cable moving as low as the 1.10 handle. Whilst this could very well be the case in the long run, presently the next significant level looks as though it should be at around the 1.1905 mark which was the low seen during Friday’s flash sell-off.
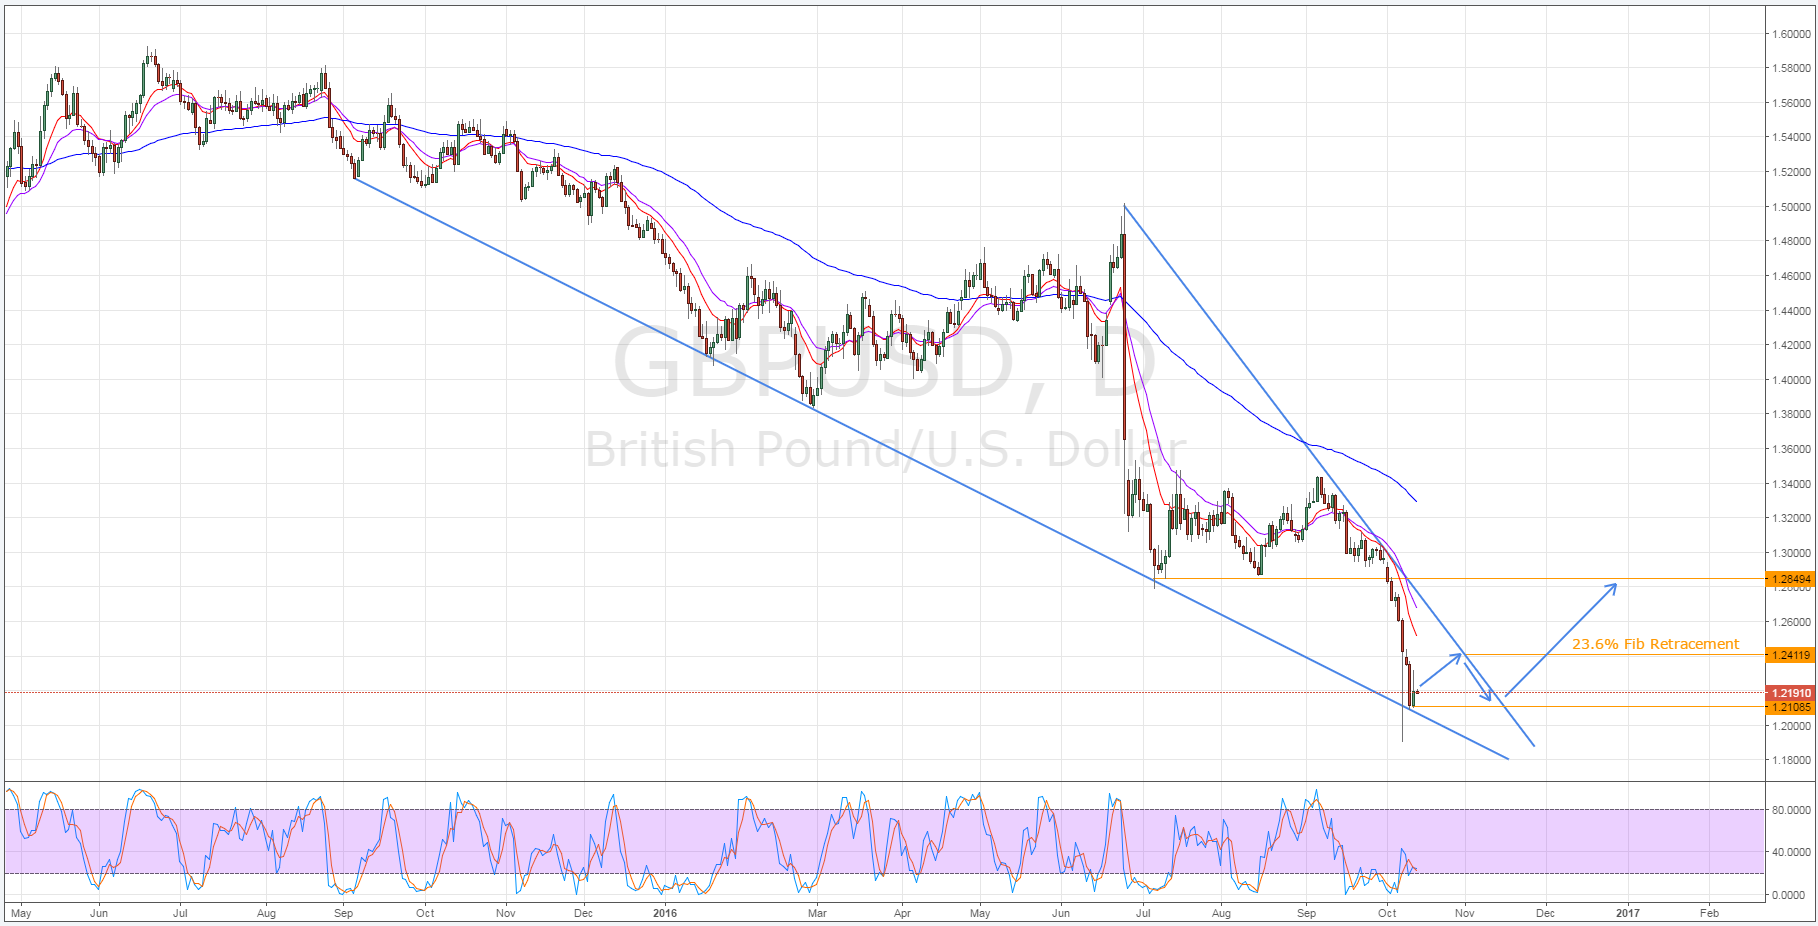
However, whilst it seems unlikely, due to the converging constraints of the falling wedge pattern there is also the possibility that we instead see an upside breakout for the cable as we move forward. As shown below, after its ranging phase the cable could move back to the 1.2108 support and subsequently break through the upside constraint, erasing the pair’s recent decline.
This being said, there is a major technical factor working against this outcome which is the daily EMA bias. Patently, the 12, 20, and 100 day averages are all highly bearish which puts significant downward pressure on this pair and this shouldn’t be ignored.

Ultimately, the GBP’s movements are largely being impacted by fundamentals at the moment which means any technical forecasts should be taken with a grain of salt.
However, this setup looks to be fairly robust and is worth keeping in mind as we move ahead. Additionally, monitor any UK and US fundamental results closely as they could prove to be the fuel needed to see a breakout occur in defiance of the EMA bias.
