Has The 2018 High For EUR/JPY Already Been Seen?

Published 05/03/2018, 03:34 AM

Despite a great start to the year and hitting a near 2.5 year high, subsequent price action has left a trail of clues that a top may already be in place.
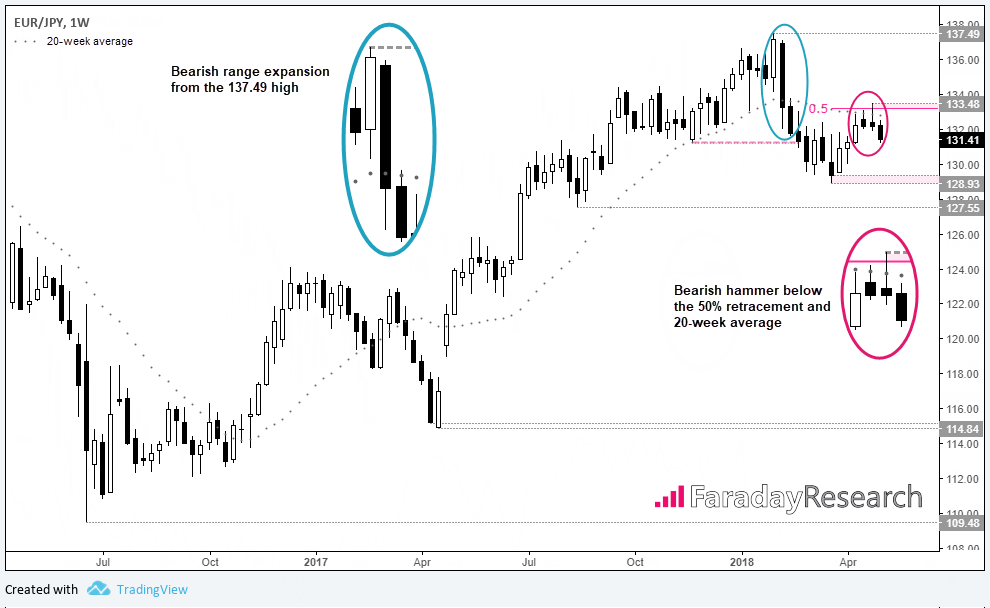
EUR/JPY 1 Weekly Chart

It was the 1st of February that EUR/JPY broke to a new high in line with dominant momentum. But the celebrations were short-lived as bearish range expansion bought it crashing back down with a vengeance just two days later. The decline from 137.49 over the next seven weeks saw EUR/JPY shed nearly 6.3% from the highs, with the first week alone accounting for a 4% drop at one point.

There has been a clear change in sentiment since the high and, that the decline also took out its prior swing low suggests a change of trend may have taken place. Yet even if this just turns out to be a deep correction against the 109.48 - 137.49 bullish run, we still see potential for losses over the near-term.

Following a rebound from the 128.93 low, a bearish hammer found resistance around a 50% Fibonacci retracement and its 20-week average. This makes the hammer a strong contender to be a lower high and, with resistance now seemingly in place, we’re seeking bearish opportunities on lower timeframes.
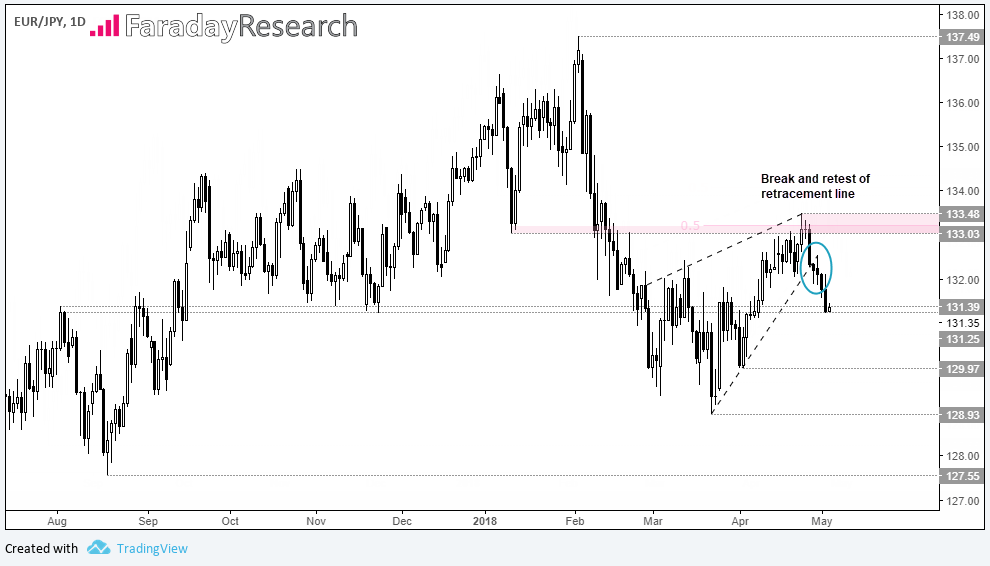
EUR/JPY 1 Day Chart

On the daily chart we can see that since peaking at 133.48, a bearish retracement line has been broken, retested and respected as resistance. This could also be part of a bearish wedge pattern which, if successful, suggests an initial target around the 128.93 lows.

However, to enter on the daily timeframe we’d prefer the daily trend structure to be predominantly bearish. Whilst near-term momentum is clearly bearish, it could pay to wait for a break beneath 128.93 before confirming a longer-term change of trend has taken place. But the breakout of the wedge following a strong rejection of the 133.03/48 area could allow short trades to be considered on intraday timeframes such as the hourly or four-hour timeframe.

Original post

Latest comments

Loading next article…
Risk Disclosure: Trading in financial instruments and/or cryptocurrencies involves high risks including the risk of losing some, or all, of your investment amount, and may not be suitable for all investors. Prices of cryptocurrencies are extremely volatile and may be affected by external factors such as financial, regulatory or political events. Trading on margin increases the financial risks.
Before deciding to trade in financial instrument or cryptocurrencies you should be fully informed of the risks and costs associated with trading the financial markets, carefully consider your investment objectives, level of experience, and risk appetite, and seek professional advice where needed.
Fusion Media would like to remind you that the data contained in this website is not necessarily real-time nor accurate. The data and prices on the website are not necessarily provided by any market or exchange, but may be provided by market makers, and so prices may not be accurate and may differ from the actual price at any given market, meaning prices are indicative and not appropriate for trading purposes. Fusion Media and any provider of the data contained in this website will not accept liability for any loss or damage as a result of your trading, or your reliance on the information contained within this website.
It is prohibited to use, store, reproduce, display, modify, transmit or distribute the data contained in this website without the explicit prior written permission of Fusion Media and/or the data provider. All intellectual property rights are reserved by the providers and/or the exchange providing the data contained in this website.
Fusion Media may be compensated by the advertisers that appear on the website, based on your interaction with the advertisements or advertisers.
© 2007-2025 - Fusion Media Limited. All Rights Reserved.