🐂 Not all bull runs are created equal. November’s AI picks include 5 stocks up +20% eachUnlock Stocks

Has Gold Just Formed A Head And Shoulders Pattern?

Published 04/21/2016, 05:23 AM
Updated 05/14/2017, 06:45 AM
XAU/USD
-
GC
-

The last few weeks have been relatively lacklustre for the yellow metal as the commodity has sought to stay within reach of the March high. However, it would appear that a relatively clear head and shoulders pattern has formed on the daily chart which could mean plenty of opportunities to trade to the short side in the coming week. Subsequently, a review of the underlying technical indicators for the commodity is highly salient given the appearance of a bearish chart pattern.

Taking a look at the various technical indicators for gold shows price action having largely broken down after failing to break through the high at $1284.01. In response, the RSI Oscillator has slowly trended away from overbought territory and has now taken on a neutral status. Additionally, the 12 and 30 EMA’s have turned relatively flat and are meandering in line with the sideways price action.

However, despite the sideways action, there is plenty of concern that the neckline of the pattern happens to coincide with a key support zone. A quick review of the chart puts that key point at $1217 which has also been a key reversal zone in the past. This area of support has been a critical zone of defence previously and a concerted breach could see gold back below the $1200 handle.

Subsequently, any such test of the neckline point will be closely watched by markets lest it forestall a sharp decline. If a breach was to occur, we could see the commodity sliding back towards strong support around the $1160 to $1141 level, which represents the 200 day MA mark. On the bullish side, a move sharply north from the head and shoulders would see the metal challenging $1263, which is a major resistance level.
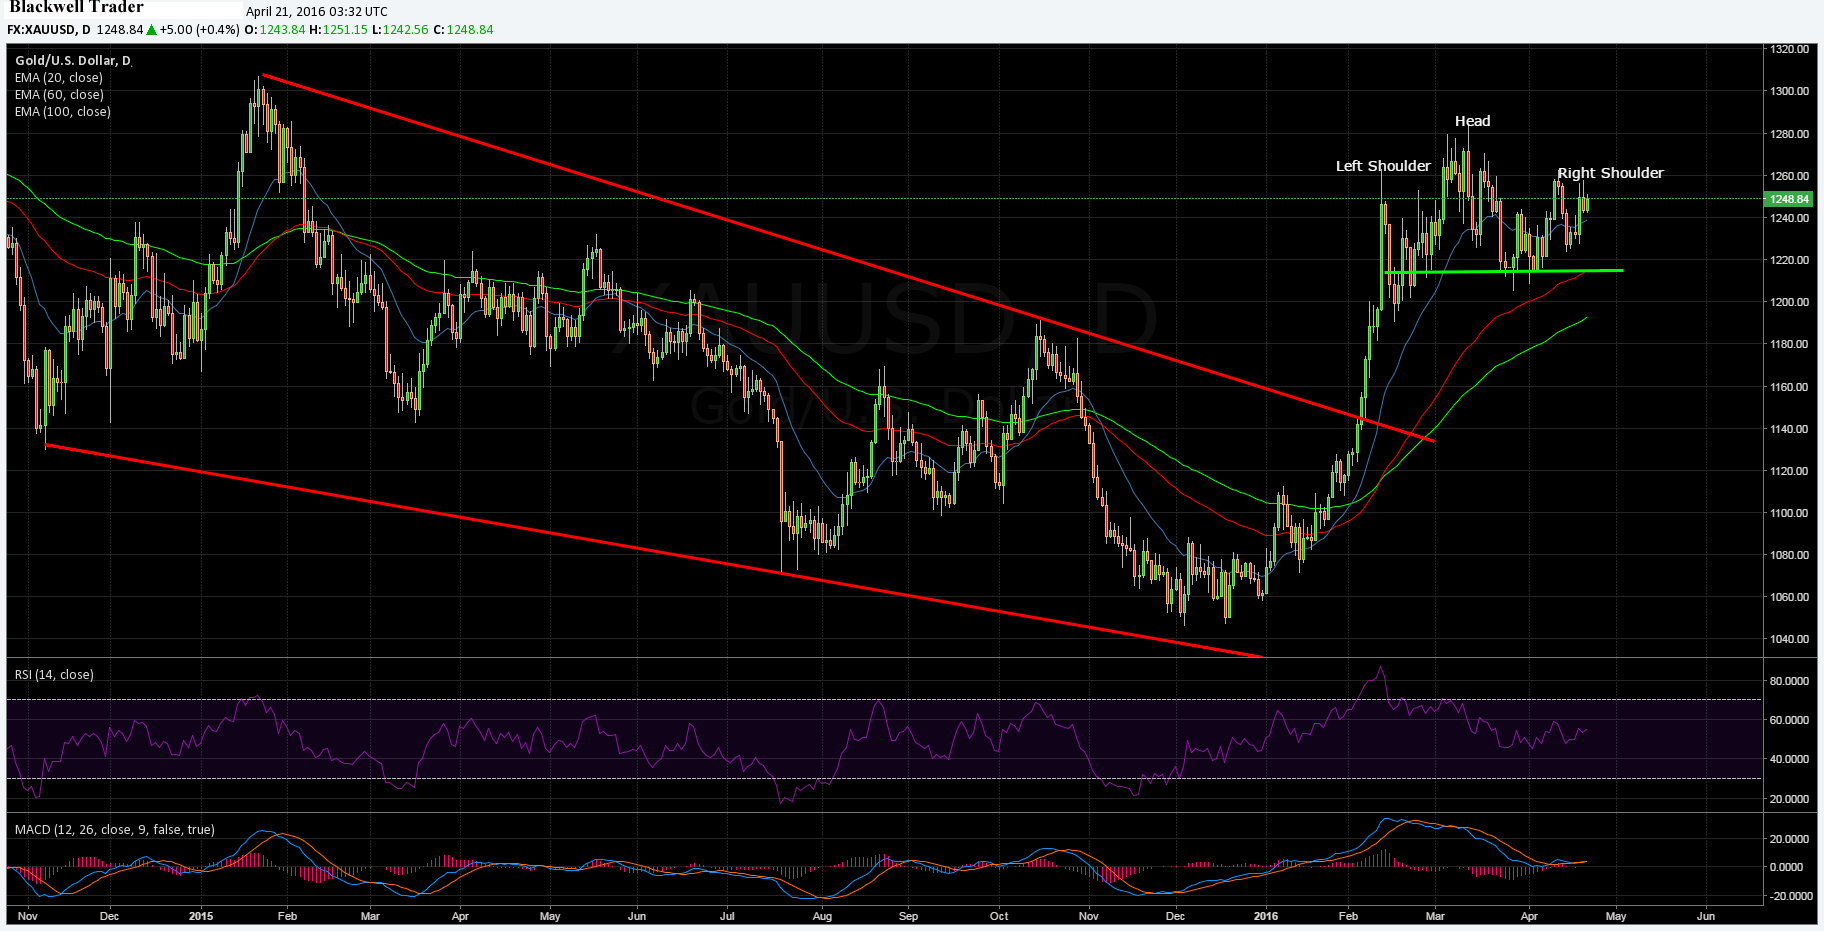
Gold Daily Chart

Ultimately, gold’s price action is undecided on its next trend direction but the downside does appear to be the likely move. Subsequently, look to sell into rallies towards the top of the range with profit targets set down towards support at $1217 an ounce. However, watch out for the fundamental and medium term view as the metal is likely to remain relatively buoyant as long as the money supply remains ridiculously expanded by the Federal Reserve.

Latest comments

Loading next article…
Risk Disclosure: Trading in financial instruments and/or cryptocurrencies involves high risks including the risk of losing some, or all, of your investment amount, and may not be suitable for all investors. Prices of cryptocurrencies are extremely volatile and may be affected by external factors such as financial, regulatory or political events. Trading on margin increases the financial risks.
Before deciding to trade in financial instrument or cryptocurrencies you should be fully informed of the risks and costs associated with trading the financial markets, carefully consider your investment objectives, level of experience, and risk appetite, and seek professional advice where needed.
Fusion Media would like to remind you that the data contained in this website is not necessarily real-time nor accurate. The data and prices on the website are not necessarily provided by any market or exchange, but may be provided by market makers, and so prices may not be accurate and may differ from the actual price at any given market, meaning prices are indicative and not appropriate for trading purposes. Fusion Media and any provider of the data contained in this website will not accept liability for any loss or damage as a result of your trading, or your reliance on the information contained within this website.
It is prohibited to use, store, reproduce, display, modify, transmit or distribute the data contained in this website without the explicit prior written permission of Fusion Media and/or the data provider. All intellectual property rights are reserved by the providers and/or the exchange providing the data contained in this website.
Fusion Media may be compensated by the advertisers that appear on the website, based on your interaction with the advertisements or advertisers.
© 2007-2024 - Fusion Media Limited. All Rights Reserved.