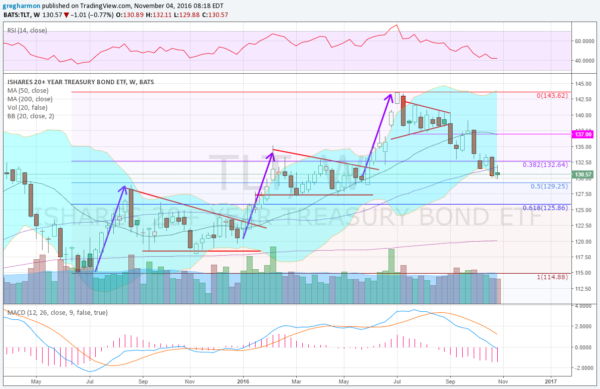
The markets in general are going through a rough patch. Some say it is because of the upcoming election, and they may be right. US Treasuries have had it rough for over 4 months at this point. Much worse than stock markets. There is the added pressure that the Fed may raise interest rates, weighing on bonds -- a double whammy. But from at least one perspective, the move lower in bonds might be coming to an end.
The chart below shows price action for the Bond ETF TLT since June 2015. That's when bonds last defied the narrative and started a bullish run higher. Digging into that procession to a top in July 2016 shows an interesting pattern, three equal moves higher. Each was followed by a consolidation in a triangular pattern. The first two triangles resolved to the upside while the third has resolved lower. This constitutes a 3-Drives Harmonic pattern.

The 3-Drives pattern is a reversal pattern and looks for a retracement lower. The initial target was a retracement of 38.2% of the pattern, a key Fibonacci level. Now that is has gone through that, the second target would be a move lower to a 61.8% retracement, at 125.86. Beyond that would look for a full retracement.
The second target is still 5 points away and there is potential for support from the prior base at 127.35 before it gets there. The RSI is leveling at the bottom of the bullish range and the MACD is just hitting the zero line. A reversal very soon would retain the bullish aspects of all of these indicators. So will it stop soon or is this ‘the big one’? Let’s watch and see.
