Disclaimer: The views shared through tweets are personal and not of my employer. Harmonic patterns are correction patterns and not reversal patterns. Any position must be taken after a thorough research.
Below are chart projections of Harmonic patterns (ABCD to be precise) for the upcoming week starting 28/10/2019 to 01/11/2019 that forecast some small inflection points along the way. Profits can be taken when prices react from the below grey box (Potential Reversal Zone) and retrace 38.2% from the beginning of the pattern. We have chosen EUR pairs because of interesting possible moves as we have also outlined some important levels to keep in mind.
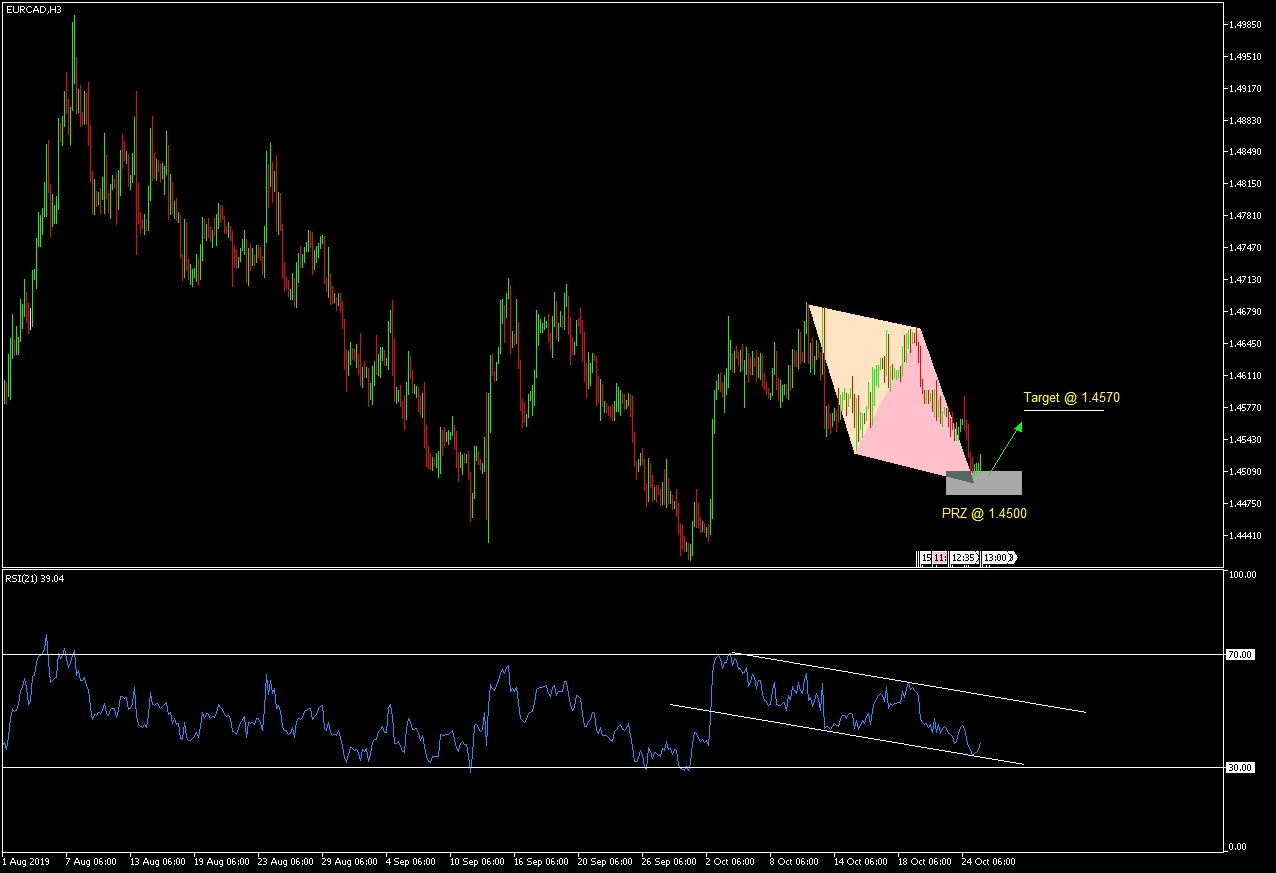
1. EUR/CAD: Expecting a bullish reversal off the PRZ around 1.4500. The harmonic pattern is coinciding well with the RSI as well as other proprietary indicators not visible on the below chart. A reasonable target can be place at 1.4570

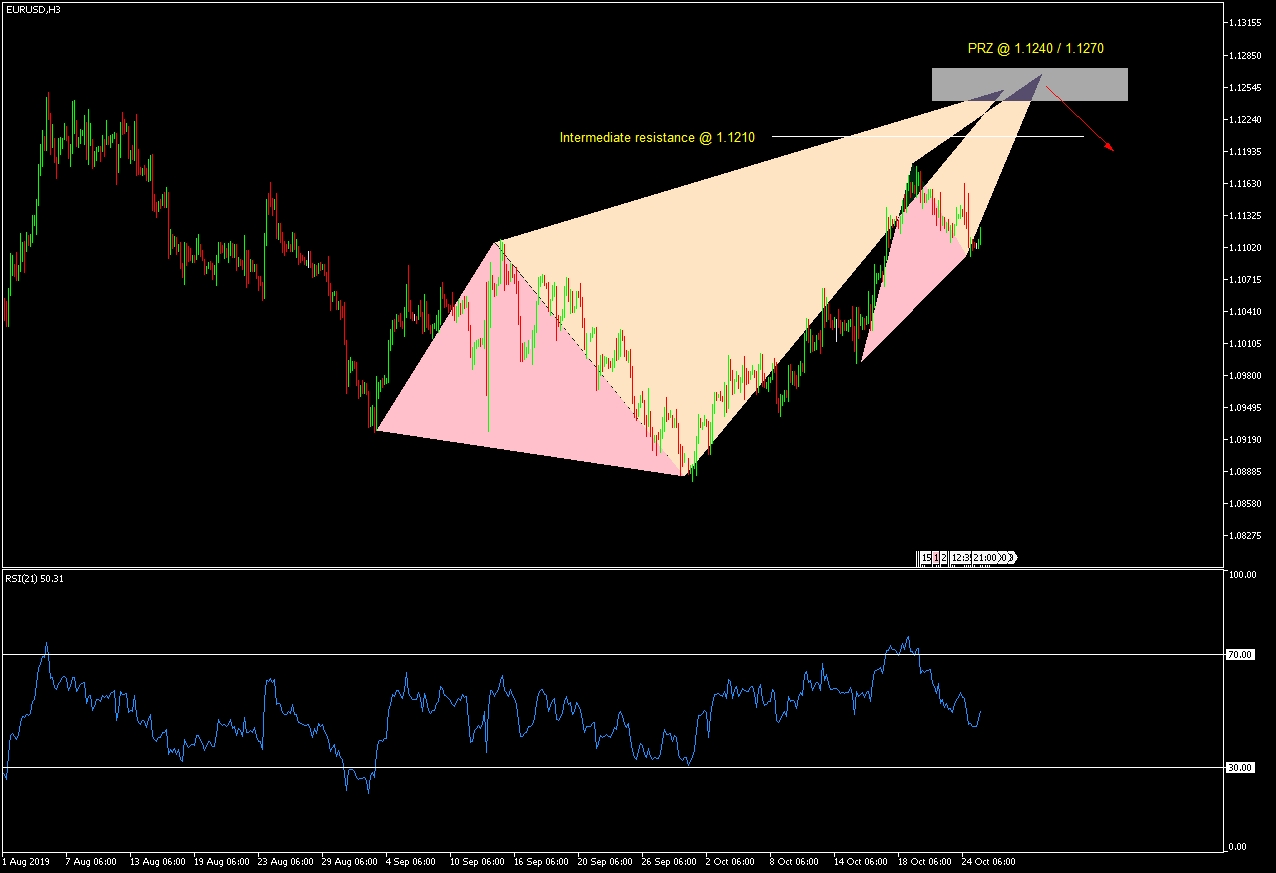
2. EUR/USD: Having done the expected reaction from last week's signal. The pair now awaits a nice short opportunity at the PRZ confluence around 1.1240/1.1270. At the moment no significant move is triggered yet. An intermediate resistance zone to play short-term moves can be placed at 1.1210 but it is not highly advised to trade on it. The RSI is still not showing clear signals.

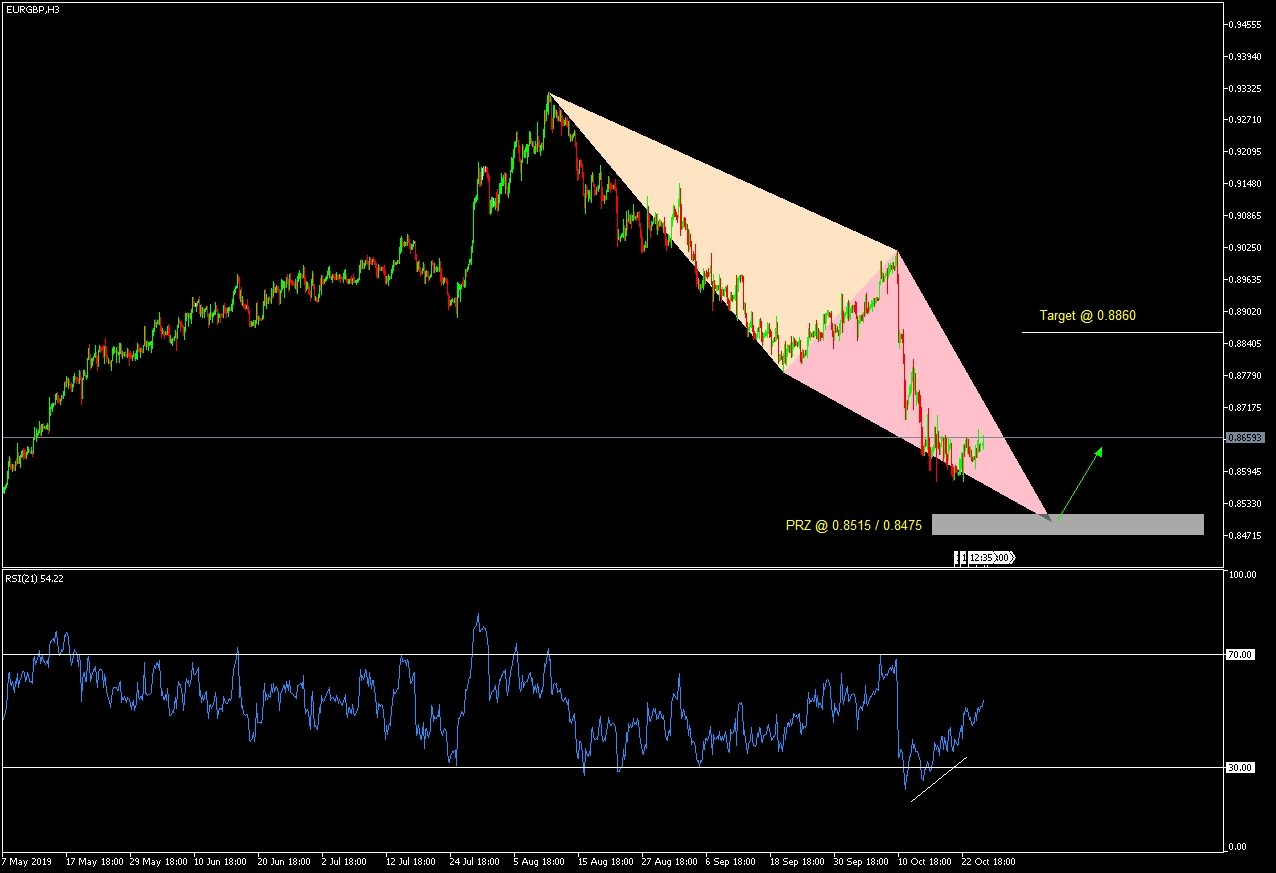
3. EUR/GBP: Expecting a bullish move around the PRZ at 0.8515/0.8475 for a target at 0.8860. The harmonic pattern is a 0.382/2.24 ABCD. RSI has been diverging signaling an exhaustion in the bearish trend.

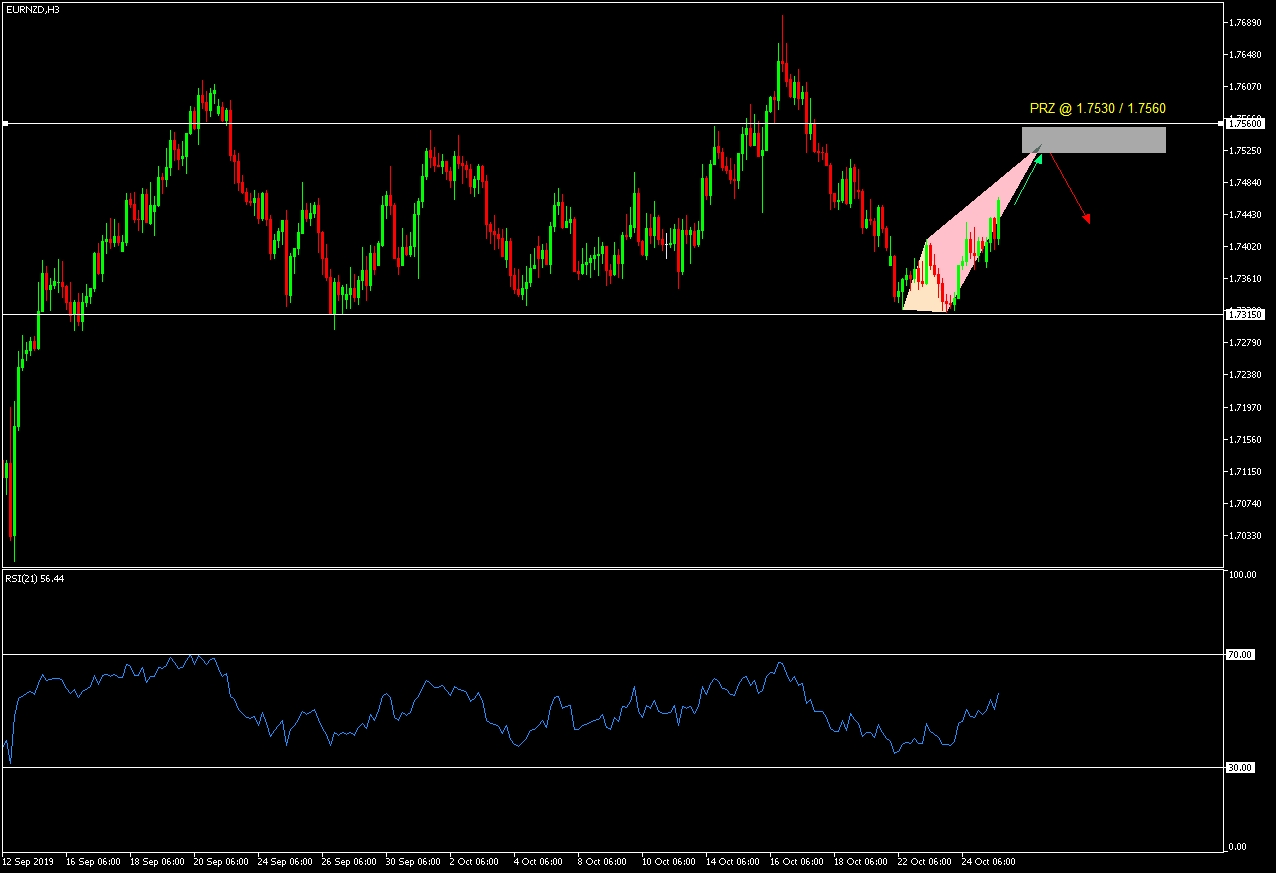
4. EUR/NZD: And finally, for the Euro kiwi pair, although harmonic patterns are not really meant for a range-bound market, they can exist inside the range as can be seen below. With a PRZ at 1.7530/1.7560, we expect a drop towards the middle of the range at least.

In conclusion, always do your own research before trading / investing. Remember, it's the fundamentals that govern the markets.
