Grupo Televisa S.A.B reports preliminary financial results for the quarter ended December 31, 2014.
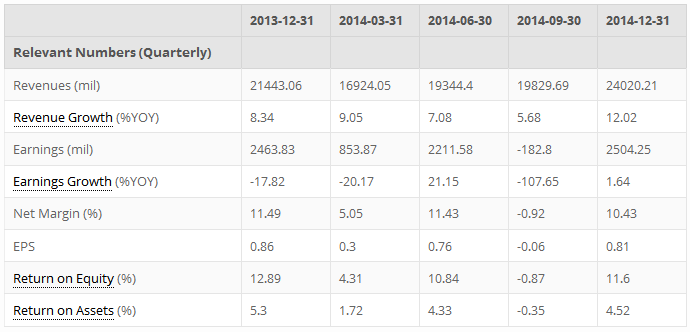
Mexican broadcaster Grupo Televisa SA (NYSE:TV)ת reported a 1.6 percent increase in fourth quarter profit to $2.5 B pesos ($169.8 million). The company’s earnings performance beat analyst expectations, as limited advertising growth due to government regulation was offset by increases in the number of satellite and cable-TV viewers. The company continued to lead in the Mexico’s pay-TV market.
Fourth quarter revenue also came in better-than-expected, and rose 12 percent to $24 B pesos. Ad sales rose 3.8 percent, while licensing and syndication sales increased 17 percent.
However, uncertainty from increased regulation threatens the company. Under a proposal by Mexico’s President Enrique Pena Nieto, the network will have to permit retransmission of its most popular channels for free.
This earnings release follows the earnings announcements from the following peers of Grupo Televisa S.A.B – TV TV Azteca Cpo, S.A.B. De C.V. (MX:AZTECACPO) and America Movil SAB de CV (NYSE:AMX).
Highlights
- Summary numbers: Revenues of MXN 24.02 billion, Net Earnings of MXN 2.5 billion, and Earnings per Share (EPS) of MXN 0.81.
- Gross margins widened from 58.41% to 61.36% compared to the same quarter last year, operating (EBITDA) margins now 39.34% from 37.92%.
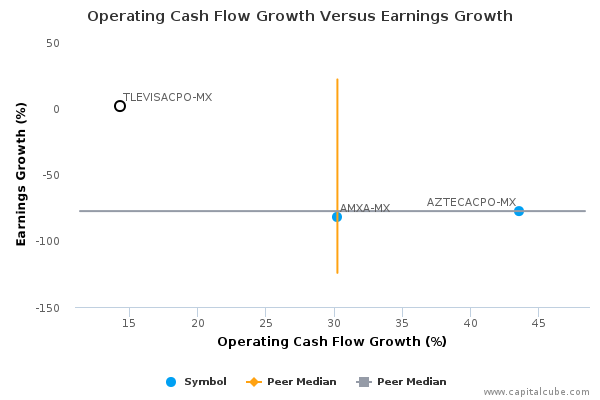
- Ability to declare a higher earnings number? Change in operating cash flow of 14.29% compared to same quarter last year better than change in earnings.
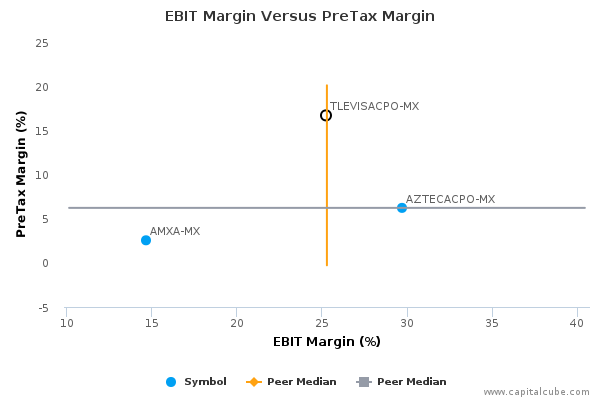
- Earnings rose compared to same quarter last year, despite decline in operating and pretax margins.
The table below shows the preliminary results and recent trends for key metrics such as revenues and net income growth:
Market Share Versus Profits
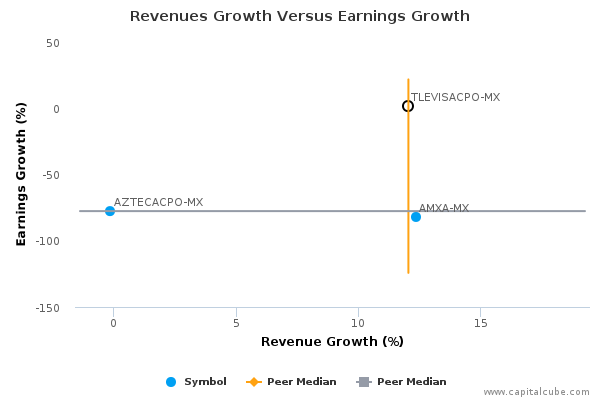
Companies sometimes focus on market share at the expense of profits or earnings growth.
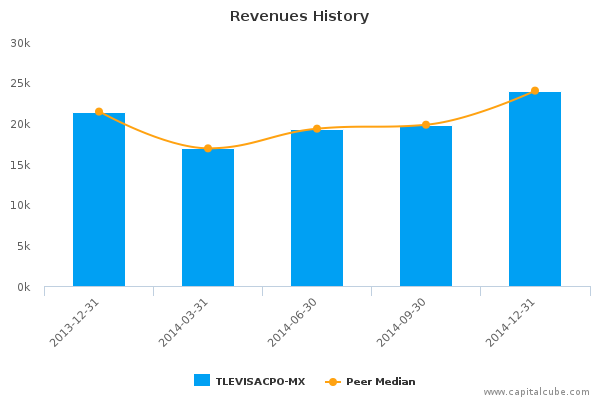
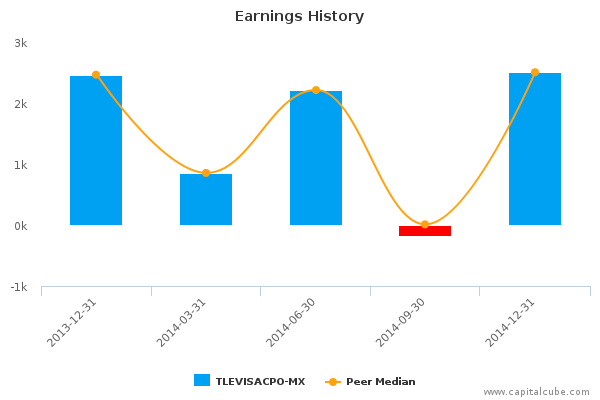
Compared to the same quarter last year, TLEVISACPO-MX's change in revenue of 12.02% surpassed its change in earnings, which was 1.64%. This suggests perhaps that TLEVISACPO-MX's focus is on market share at the expense of bottom-line earnings. However, this change in revenue is better than its peer average, pointing to perhaps some longer lasting success at wrestling market share from its competitors, and helping Capital Cube look past its weaker earnings performance this period. Also, for comparison purposes, revenues changed by 21.13% and earnings by 1,469.93% in the quarter ended September 30, 2014.
Earnings Growth Analysis
The company's earnings growth was influenced by year-on-year improvement in gross margins from 58.41% to 61.36% as well as better cost controls. As a result, operating margins (EBITDA margins) rose from 37.92% to 39.34% compared to the same period last year. For comparison, gross margins were 62.14% and EBITDA margins were 40.11% in the quarter ending September 30, 2014.
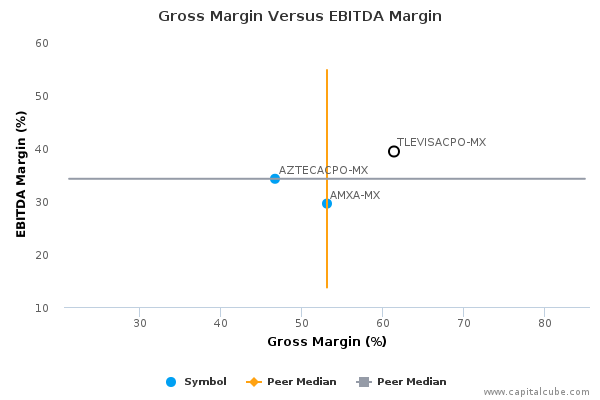
Gross Margin Trend
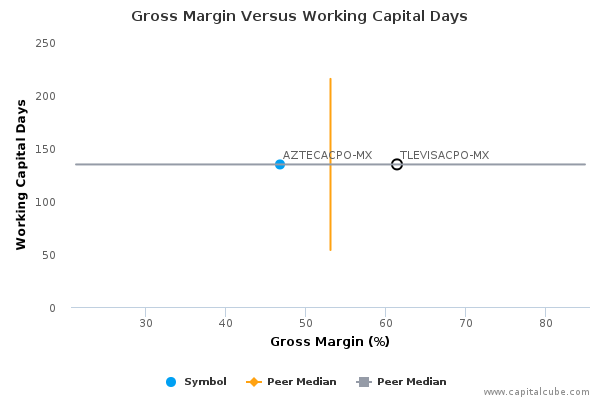
Companies sometimes sacrifice improvements in revenues and margins in order to extend friendlier terms to customers and vendors. Capital Cube probes for such activity by comparing the changes in gross margins with any changes in working capital. If the gross margins improved without a worsening of working capital, it is possible that the company's performance is a result of truly delivering in the marketplace and not simply an accounting prop-up using the balance sheet.
TLEVISACPO-MX's improvement in gross margins have been accompanied by a deterioration in the management of working capital. This leads Capital Cube to conclude that the improvements in gross margins are likely accounting trade-offs with the balance sheet and not strictly from operating decisions. Its working capital days have risen to 134.51 days from last year's levels of 68.82 days.
Cash Versus Earnings – Sustainable Performance?
TLEVISACPO-MX's year-on-year change in operating cash flow of 14.29% is better than its change in earnings. This suggests that the company might have been able to declare a higher earnings number. But, this change in operating cash flow is lower than the average of the results announced to date by its peer group.
Margins
Despite a decline in operating (EBIT) margins as well as a decline in pretax margins, the company's earnings rose.
Company Profile
Grupo Televisa SAB engages in the providing media products and services. The company operates through the following segments: Content, Publishing, Sky, Cable and Telecom, and Other Businesses. The content segment includes Advertising, Network subscription Revenue and Licensing and Syndication. The Publishing segment sells advertising pages in its magazines. The Sky segment includes direct-to-home satellite services. The Cable and Telecom segment operates a cable television system that provides telephone and internet subscription, pay-per-view programming, and television subscription. The Others business segment handles the promotion of sports and special events, distribution of feature films, gaming, radio, and publishing distribution. The company was founded in 1930 and is headquartered in Mexico City, Mexico.
