How do you squeeze 20,000 Russian merchants into 15,000 available commercial plots at the market?
The answer is blockchain...

Of course, it's impossible to fit 20,000 people into 15,000 spaces but it seems that the application process has become so unreliable that the government is now turning to the Ethereum network to provide a transparent and immutable way to divvy them out fairly.
Yet another example of how Ethereum is changing the world one project at a time.
Today's Highlights
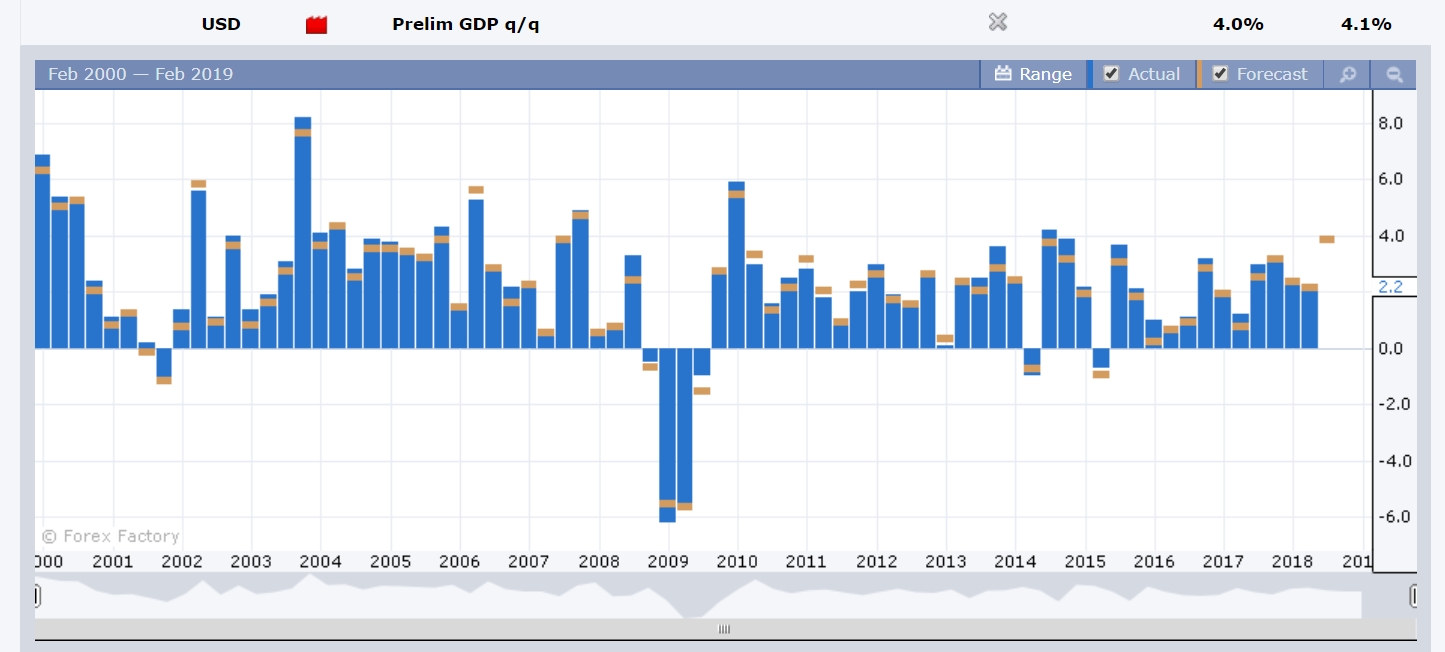
Outstanding Growth
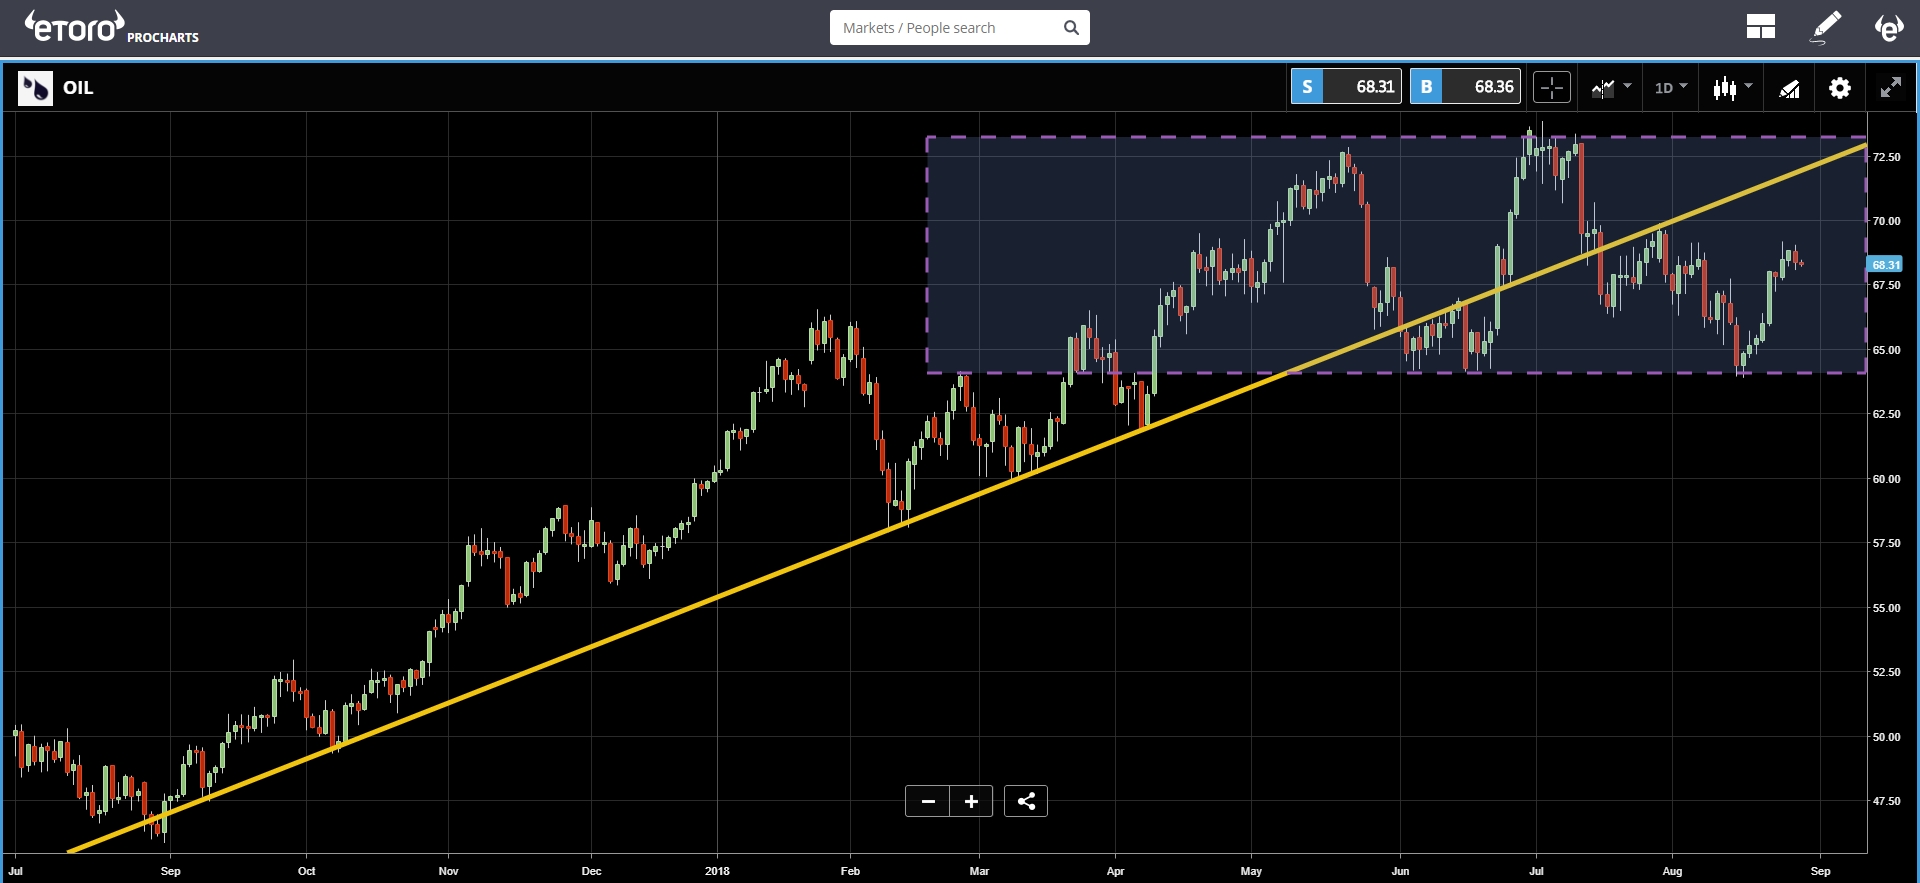
Oil Ranging
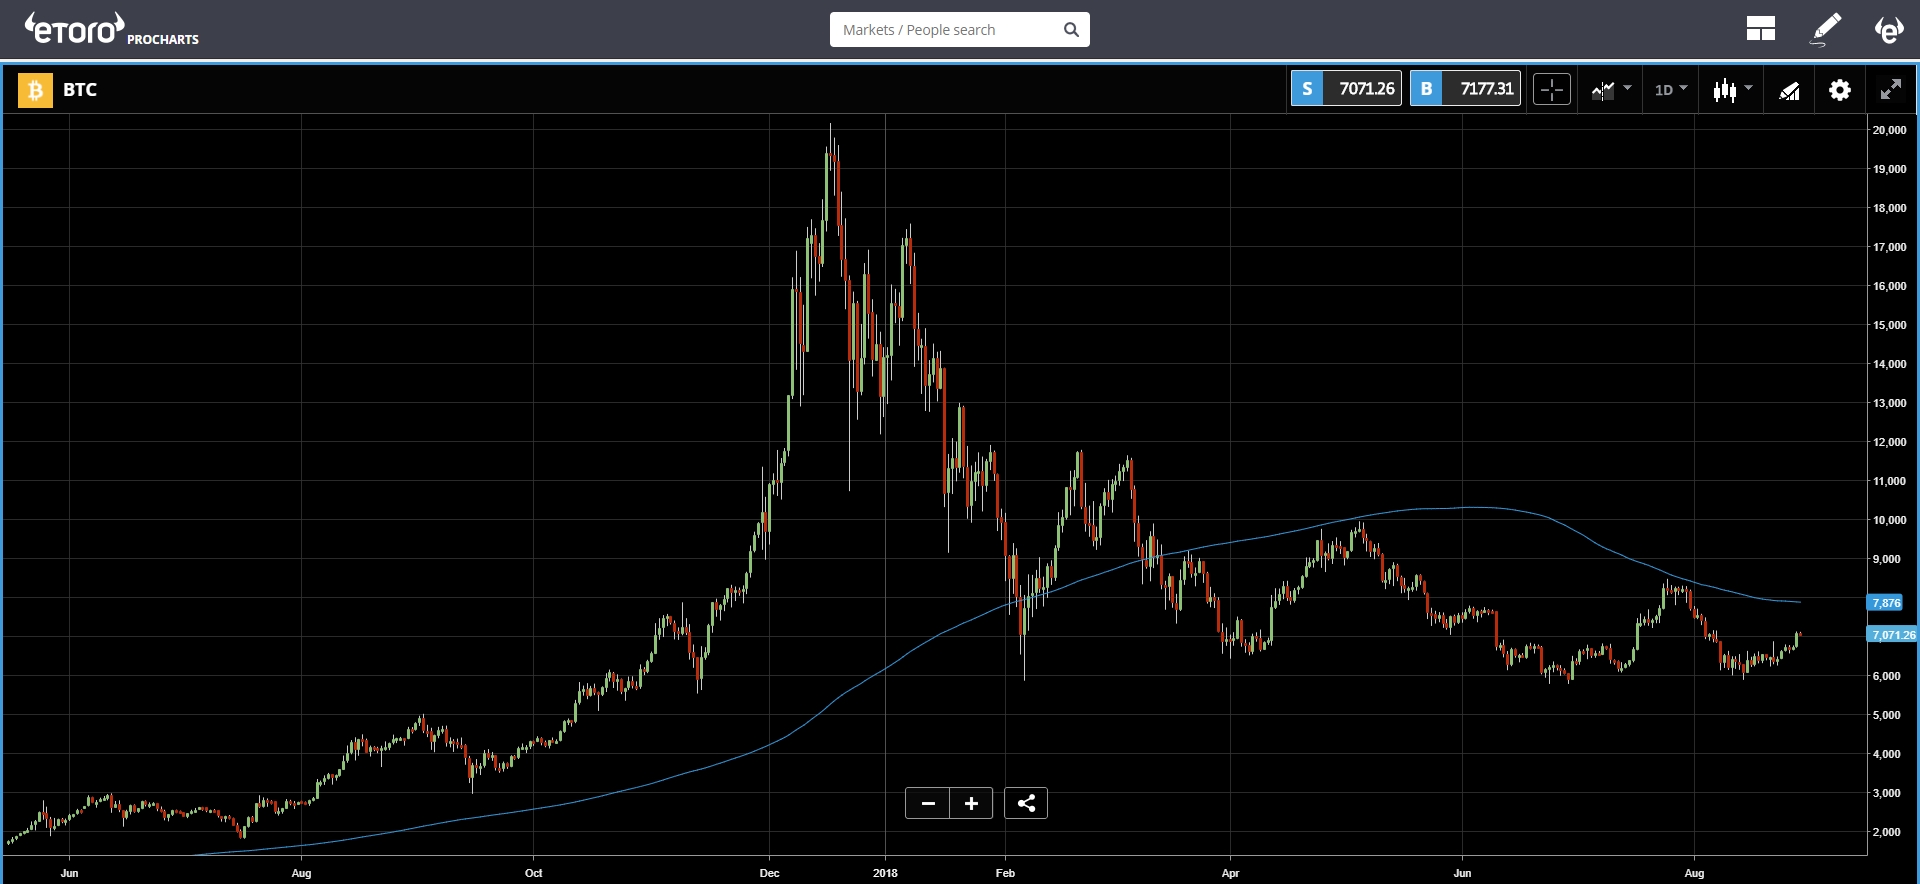
Bitcoin Holding 7k
Please note: All data, figures & graphs are valid as of August 29th. All trading carries risk. Only risk capital you can afford to lose.
Traditional Markets
Geopolitical analysts will be watching closely for updates on what's now being called the New NAFTA deal, but many macro-economists will prefer to watch the growth numbers coming out of the USA today.
At 8:30 AM in New York, about an hour before the opening bell, the Preliminary GDP figure is largely expected to be announced at above 4% growth for the United States. If the forecasters are indeed correct, this will be the best reading in four years...

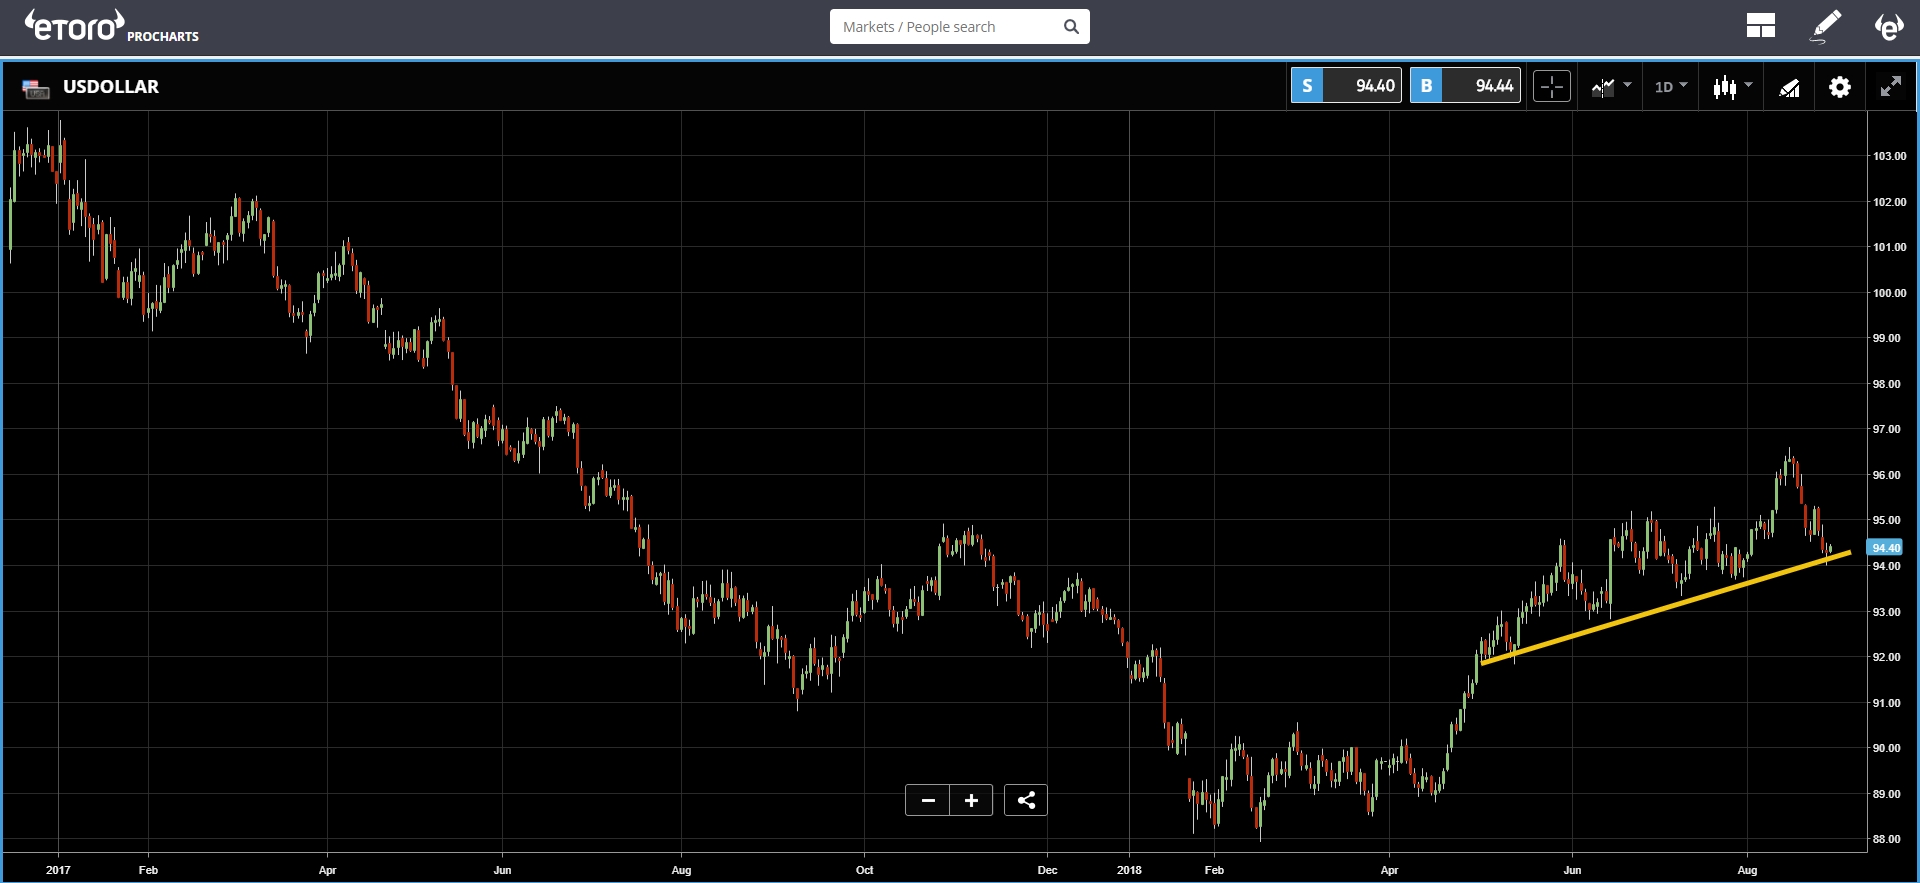
As we've discussed, theUS Dollar's rally since mid-April has lately been dominating the market's attention. The last two weeks have provided a pullback from the extreme peak but it seems we may now be coming on some support (yellow line).
Should today's data confirm a strong US economy, the Dollar may well resume it's encompassing trend.

Today we'll also see an important meeting between representatives from Saudi Arabia and Russia, who might be keen to comment on the outlook for oil production going forward.
Crude oil has been trading in a steady range between $64 and $73 ever since the Dollar rally started in mid-April.

We'll also get the oil inventories figures out of the United States an hour after the bell, a number that does tend to have a fair impact on the market depending on the results.
Crypto Rally
Bitcoin has broken and is now holding above the $7,000 a great sign indeed. As far as the chart is concerned though, we still don't have any seriously significant movement to analyse just yet.
We're still looking at the 200-day moving average (blue line) as the roof and the floor coming in above $5,000.

Institutional interest in the crypto space is definitely rising fast. Here's an article that we recently published forecasting just how it could all play out.
That doesn't necessarily mean that we'll go from here to the moon by next month though. Big money tends to be cautious, especially while we lack clarity. While the bear is gone, the bulls remain hesitant to reveal themselves.
Let's have an awesome day ahead!
eToro, Senior Market Analyst
Disclosure: This content is for information and educational purposes only and should not be considered investment advice or an investment recommendation. Past performance is not an indication of future results. All trading carries risk. Only risk capital you're prepared to lose.
Which stock should you buy in your very next trade?
AI computing powers are changing the stock market. Investing.com's ProPicks AI includes 6 winning stock portfolios chosen by our advanced AI. In 2024 alone, ProPicks AI identified 2 stocks that surged over 150%, 4 additional stocks that leaped over 30%, and 3 more that climbed over 25%. Which stock will be the next to soar?
Unlock ProPicks AI