How has the US stock market performed so far this year? The answer, as always, depends on the definition of “the market.” If we’re slicing and dicing by factor buckets these days, the possibility of radically different answers has rarely been so stark.
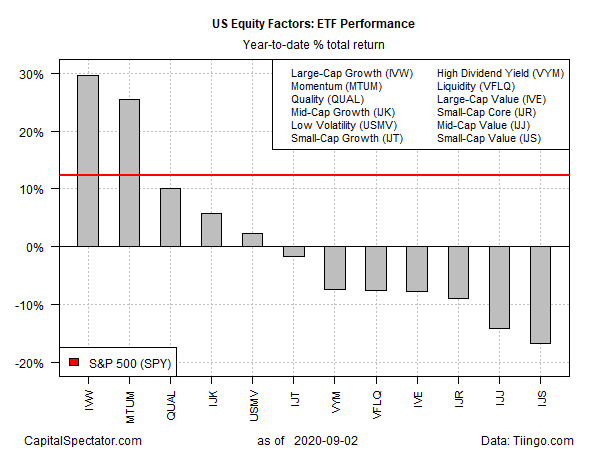
The leading performances for the growth and momentum buckets in the US stock market continue to pull ahead, based on a set of exchange-traded funds. Meanwhile, the laggards are falling further behind. At the extreme, the spread between the best and worst year-to-date performances for the factor group is approaching an astonishing 50 percentage points, as of the close of trading on Sep. 2.
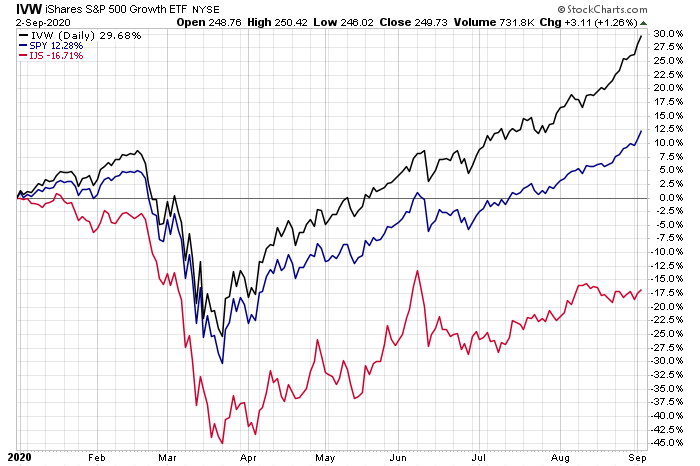
At the top of 2020 results: S&P 500 Growth ETF (NYSE:IVW)), which is up a red-hot 29.7% so far this year. That’s a remarkable gain, in part because it’s more than double the broad market’s year-to-date increase, based on SPDR S&P 500 (SPY), which is ahead 12.3%.
An even wider gap exists between IVW’s dramatic rally this year and the weakest factor performer on our list via iShares S&P Small-Cap 600 Value (NYSE:IJS), which has shed a hefty 16.7% in 2020 through yesterday’s close. The performance spread between these two outliers now stands at more than 46 percentage points.

Note, too, that while large-cap growth and momentum are far ahead in this year’s horse race, the majority of equity risk factors remain underwater for 2020. Seven of the 12 risk factors we track via ETFs are currently posting year-to-date losses. For the five funds with gains so far this year, growth and momentum are hogging the lion’s share of the returns.

The fact that most of the equity factor realm is in the red this year is surprising when you consider that the stock market overall is up sharply. But if you were expecting that a strong tailwind from broad market beta would lift all boats, 2020 is a wake-up call for thinking otherwise.
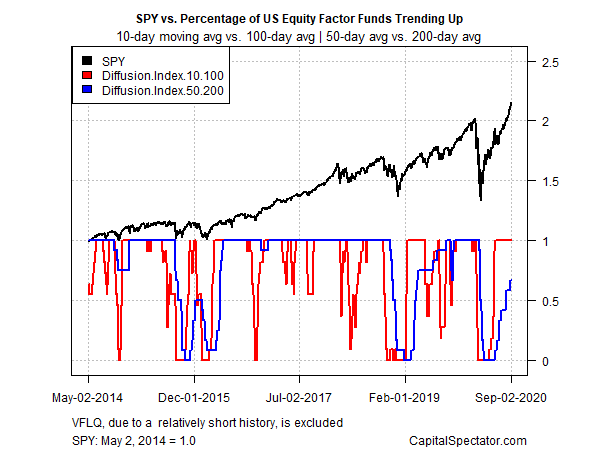
Profiling trends for the factor ETFs listed above shows that a growing share of funds are joining the party. Despite the year-to-date losses for most factors, more than half of the ETFs listed above are now posting positive medium-term momentum. Meantime, all the funds continue to reflect bullish short-term momentum. This profile is based on two sets of moving averages. The first measure compares the 10-day average with its 100-day counterpart — a proxy for short-term trending behavior (red line in chart below). A second set of moving averages (50 and 200 days) represents an intermediate measure of the trend (blue line).

