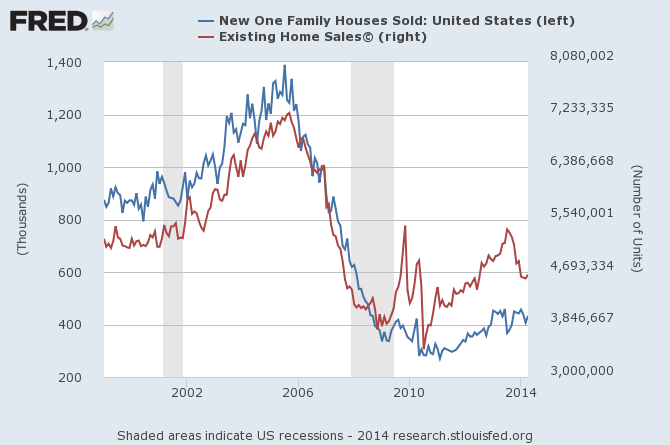
I have been fairly negative on the prospects for residential construction - this negativity was partially caused by the slowdown in existing home sales. Existing and new homes sales historically appear joined at the hip.
Follow up:
The process to build new homes is long - starting with planning, permits, construction and ending with the sale of the home. The number of homes in the pipeline (building permits issued) has been trending down for almost one year, and now is in contraction year-over-year.
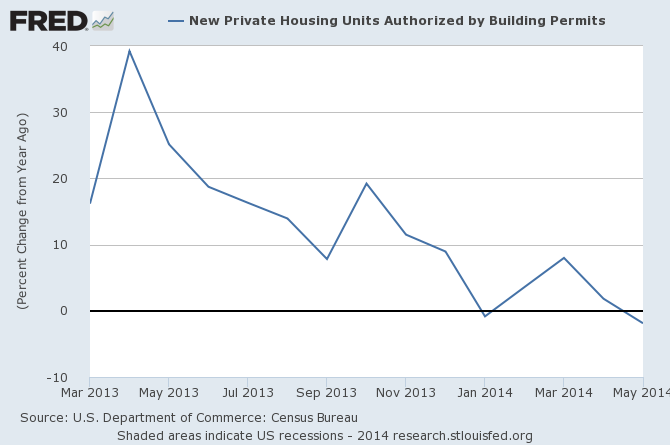
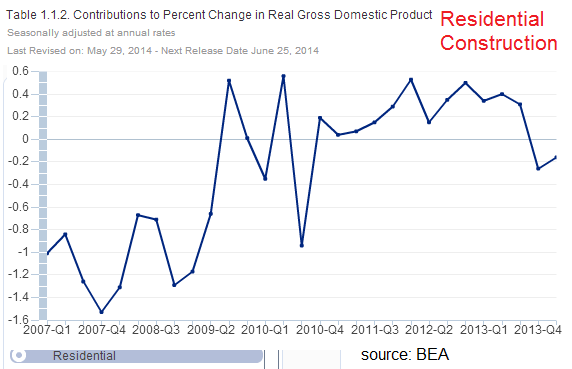
The effect of low permits will manifest in lower construction spending months from now as fewer homes will be built. Already, residential construction is a 0.2% headwind to GDP. During the peak of the Great Recession, residential construction slowdown removed over 1% of GDP.
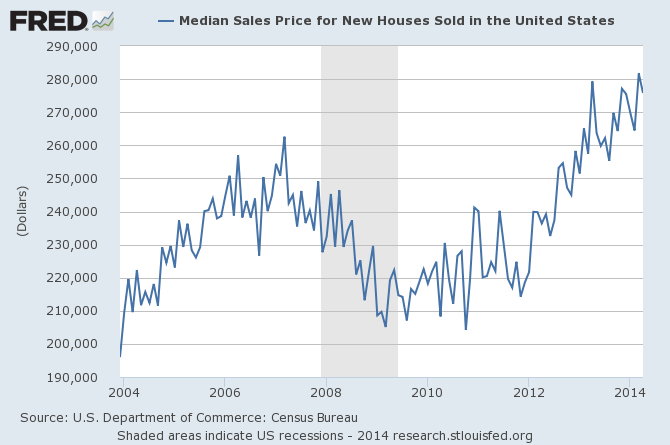
This is an interesting situation because logic dictates that the USA population growth of 1% a year should have eaten enough of the surplus housing (caused by the overbuilding in the late 1990s and 2000s) that residential home sales should have picked up now that we are 8 years after the beginning of the housing crash. Is the home price recovery beginning to stifle housing demand?
Whatever the case, whatever the root causes - this is far from an economically positive event.
Other Economic News this Week:
The Econintersect Economic Index for June 2014 is showing continued growth acceleration. Outside of our economic forecast - we are worried about the consumer's ability to expand its consumption as the ratio between income and expenditures are near all time highs. The GDP contraction for 1Q2014 is a paper contraction as GDP is determined by playing games with accounts. No serious element of the economy was in contraction (except government spending) which is already expanding in the 2Q2014.
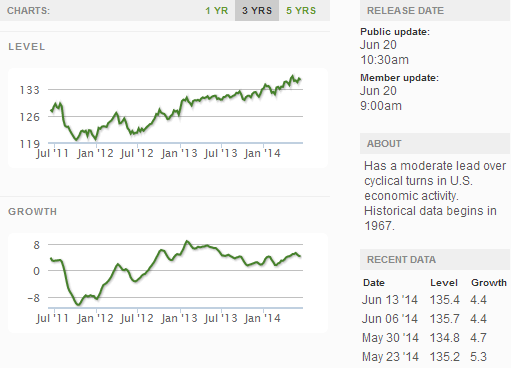
The ECRI WLI growth index value has been weakly in positive territory for many months - but now in a noticeable improvement trend. The index is indicating the economy six month from today will be slightly better than it is today.
Current ECRI WLI Growth Index
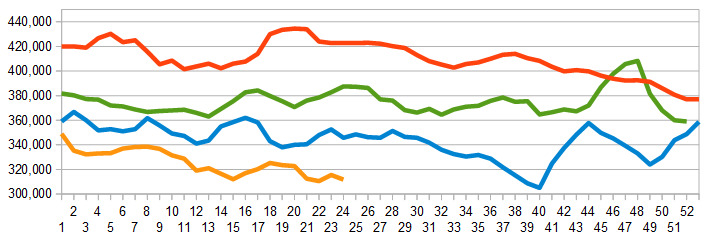
The market was expecting the weekly initial unemployment claims at 295,000 to 315,000 (consensus 313,000) vs the 312,000 reported. The more important (because of the volatility in the weekly reported claims and seasonality errors in adjusting the data) 4 week moving average moved from 315,500 (reported last week as 315,250) to 311,750.
Weekly Initial Unemployment Claims - 4 Week Average - Seasonally Adjusted - 2011 (red line), 2012 (green line), 2013 (blue line), 2014 (orange line)
Bankruptcies this Week: Privately-held Aramid Entertainment Fund Limited, Momentive Performance Materials (MPM), Revel AC, Kid Brands
Weekly Economic Release Scorecard:
Click here to view the scorecard table below with active hyperlinks
