
Groupon Inc. (NASDAQ:GRPN) reported non-GAAP second-quarter 2017 earnings of 2 cents per share compared with 3 cents in the year-ago quarter. The reported figure was much better than non-GAAP loss per share of 4 cents in the previous quarter. The sequential improvement in the bottom-line can primarily be attributed to the company’s streamlining activities.
Including stock-based compensation, the figure was a loss of 1 cent per share, narrower than the Zacks Consensus Estimate of a loss of 4 cents per share.
Revenues of $662.6 million missed the Zacks Consensus Estimate of $669 million and also declined 8.4% on a year-over-year basis.
Groupon’s focus on domestic market is helping in acceleration of gross profit. The company’s North American local units continue to grow with the addition of new customers, partially offset by the departure of LivingSocial customers.
The company entered into a long-term commercial deal with Grubhub (NYSE:GRUB) in the quarter, which is anticipated to be a growth driver going forward.
Nevertheless, the rollout of the company’s new card-linked platform, Groupon+ that replaces the voucher system and makes discounting processes easy will be a tailwind.
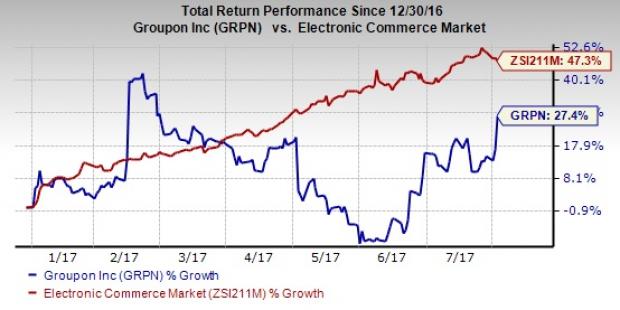
Notably Groupon stock has gained 27.4% year to date, underperforming the 47.3% rally of the industry it belongs to.
Revenue Details
Region-wise, North America revenues decreased 12.6% from the year-ago quarter while International revenues increased 1.9% year over year.
Billings from North America were up 0.8% year over year. However, international billings declined 7.9%.
North America local gross billings of $615.83 million grew 13.5%. Local revenues of $207.53 million grew 12.7% from the year-ago quarter. However, goods billings declined 22.8% to $245.92 million and revenues fell 28.7% to $222.06 million.
As of Jun 30, 2017, the company had approximately 48.3 million active customers globally. Groupon added nearly 300K new customers in North America during the quarter. Active customers in North America were 31.9 million at the end of the quarter.
Groupon, Inc. Price, Consensus and EPS Surprise
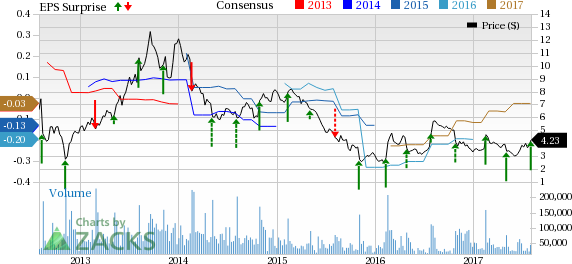
Groupon, Inc. Price, Consensus and EPS Surprise | Groupon, Inc. Quote
Operating Details
Gross margin increased 590 basis points (bps) on a year-over-year basis to 49.5% in the quarter. North America gross profit increased 8%, while internationally it declined 4% (1% Fx-neutral).
Adjusted EBITDA margin expanded 310 bps to 8%, reflecting the successful implementation of the company’s streamlining strategies.
Groupon’s operating expenses (excluding one-time items) decreased 4.9% year over year to $330.84 as SG&A declined 11%.
Operating loss (excepting one-time items) was $2.77 million compared with a loss of $32.54 million in the year-ago quarter.
Balance Sheet and Cash Flow
As of Jun 31, 2017, Groupon had cash & cash equivalents worth $618.6 million compared with $691 million as of Mar 31, 2017.
During the second quarter, Groupon repurchased 7,185,453 shares of its common stock for an aggregate purchase price of $24.8 million.
Outlook
For third-quarter 2017, Groupon expects EBITDA to decline sequentially as the company plans to continue its investments in marketing and offline campaigning activities. However, EBITDA is expected to increase from the year-ago quarter figure of $36 million.
For 2017, Groupon projects gross profit to remain in the range of $1.30 billion to $1.35 billion.
Also, adjusted EBITDA is projected in the range of $215 million-$240 million, the lower end of the range being raised from $210 million.
Zacks Rank & Stocks to Consider
Currently, Groupon carries a Zacks Rank #3 (Hold). You can see the complete list of today’s Zacks #1 Rank (Strong Buy) stocks here.
Better-ranked stocks in the industry are Alibaba Group Holding Limited (NYSE:BABA) and Applied Optoelectronics, Inc. (NASDAQ:AAOI) , both sporting a Zacks Rank #1.
Long-term earnings growth rate for Alibaba Group, Applied Optoelectronics are projected to be 28.9% and 18.7%respectively.
More Stock News: Tech Opportunity Worth $386 Billion in 2017
From driverless cars to artificial intelligence, we've seen an unsurpassed growth of high-tech products in recent months. Yesterday's science-fiction is becoming today's reality. Despite all the innovation, there is a single component no tech company can survive without. Demand for this critical device will reach $387 billion this year alone, and it's likely to grow even faster in the future.
Zacks has released a brand-new Special Report to help you take advantage of this exciting investment opportunity. Most importantly, it reveals 4 stocks with massive profit potential.
Groupon, Inc. (GRPN): Free Stock Analysis Report
Alibaba Group Holding Limited (BABA): Free Stock Analysis Report
GrubHub Inc. (GRUB): Free Stock Analysis Report
Applied Optoelectronics, Inc. (AAOI): Free Stock Analysis Report
Original post
Zacks Investment Research