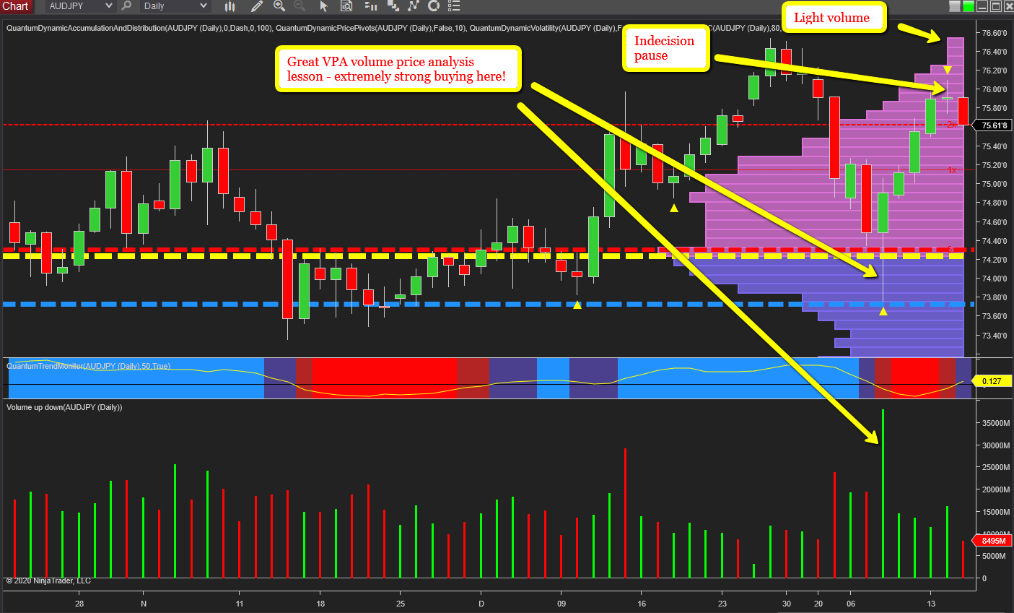
A great VPA, volume price analysis lesson on the daily chart for the Aussie-yen and which delivered several excellent days of gains for forex traders who use volume as part of their trading methodology. In this case it was on the relatively slow timeframe of the daily chart, yet the methodology works in all timeframes from the fastest to the slowest and the principles are identical in each.
In this case it was the price action of the 8th of January, driven by geopolitical events which saw the pair plunge and recover along with equity markets, whilst gold did the reverse. As we can see, the volume associated with this candle was the highest on the chart and at an extreme level, sending a clear signal of one thing. The market makers are buying and buying big. This was enough to take a long position with the pair rising over 120 pips before pausing yesterday with a doji candle ahead of today’s key news on the US/China trade agreement. Should the markets perceive this as positive, we can expect to see further gains for the pair, along with others in the yen complex, aside from the GBP, which has local fundamental weakness and the potential for an imminent interest rate cute on weak inflation data, coupled with post Brexit exhaustion!
For the AUD/JPY, the journey ahead looks relatively straightforward, with volume falling away on the volume point of control histogram as we move on to 76.60 and beyond. Longer term, it will be fundamentals which once again drive this pair if the carry trade takes hold on positive economic data from Australia. A way off yet perhaps.
Charts from NinjaTrader and indicators from Quantum Trading
