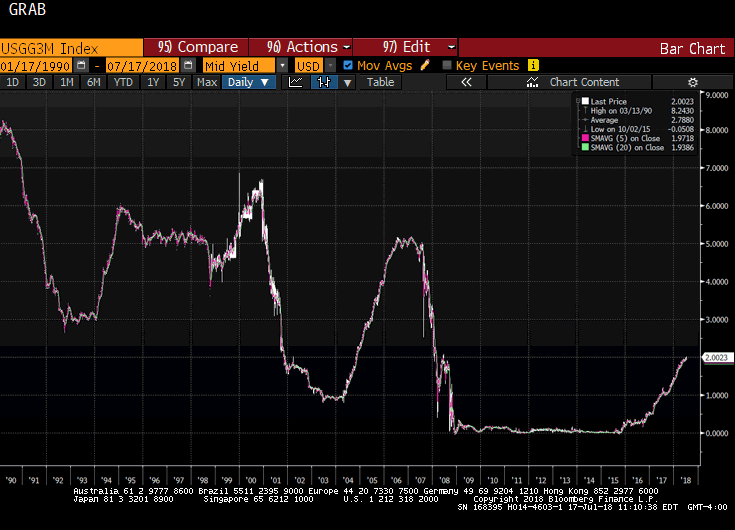
The yield on the 3-month US Treasury bill is pushing above 2% today for the first time since 2008. The yield had briefly dipped below zero as recently as late 2015.
Although today's yield seems high, this Great Graphic shows the nominal generic three-month yield going back to 1990. Then the three-month bill yielded 8%. The peak in the last cycle (2006-2007) was a little above 5%.

It is true that in the past, business cycles also produced more inflation. However, here we are, nine years since the end of the last recession and the Federal Reserve has been lifting the Fed funds target since late 2015 while the 3-month bill yield remains negative. June headline CPI stood at 2.9%.
Not only is the real yield negative, but despite the divergence of policy that I emphasize, US real rates are lower than the other major financial centers. Consider that the generic EMU 3-month bill is yielding minus 55 bp. Tomorrow, the EMU is expected to report that headline inflation may have been 2.0% rather than 1.9% of the flash. While US real yield is negative ~90 bp, EMU's is around 1.55%.
Japan's 3-month bill yields minus 15 bp. Japan reports June CPI figures ahead of the weekend. It is expected to tick up to 0.8% from 0.7%. That translates to a real yield of about 65 bp.
The UK's 3-month T-bill is yielding almost 70 bp. The June CPI will be reported tomorrow. It is expected to have risen to 2.6% from 2.4%. Deducting the current CPU from the yield generate a real return of about 90 bp.
