Finding a respectable yield in the global markets hasn’t been easy in recent years and nothing’s changed in 2021. This is a bit surprising when you consider that interest rates have been rising this year. But while investors buying medium-to-long-term Treasuries, for example, are offered higher rates these days, it’s another story in major asset classes via a set of ETF proxies.
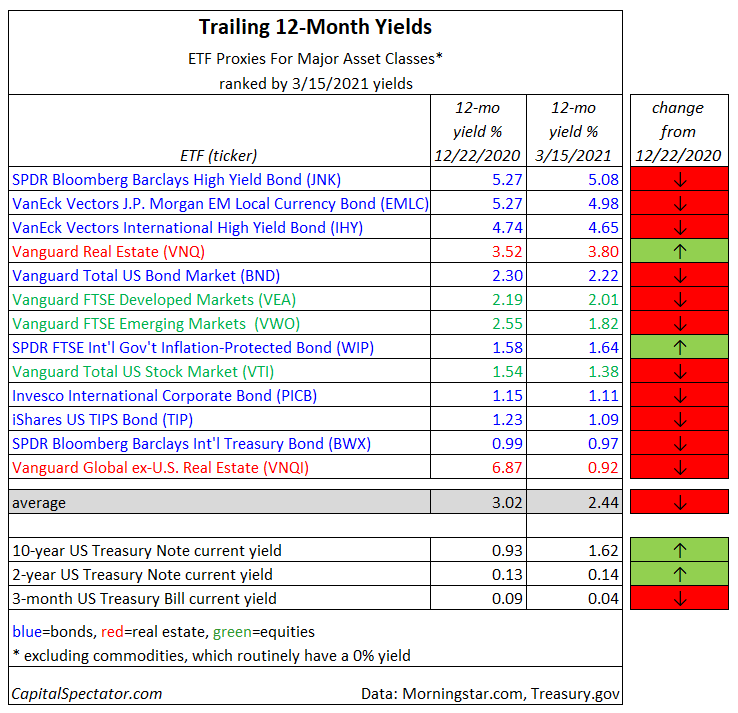
As the table below shows, most slices of global markets are paying out lesser yields relative to our previous update on Dec. 23, 2020. The highest payout (based on trailing 12-month yields reported by Morningstar.com) is found in the land of US junk bonds. SPDR Bloomberg Barclays High Yield Bond (NYSE:JNK) posted a 5.08% yield for the past year.

The smallest yield (excluding the perennially 0% yielding commodities space) is in foreign property shares. Vanguard Global ex-U.S. Real Estate Index Fund ETF (NASDAQ:VNQI) paid a thin 0.92% over the trailing 12-month window.
Only two ETFs reflect higher payouts compared with the Dec. 23 update. Vanguard Real Estate (NYSE:VNQ), a US portfolio of real estate investment trusts (REITs), has a 3.80% yield, or slightly higher than the rate reported in our previous update. Foreign inflation-indexed government bonds also posted a slightly higher yield. SPDR FTSE International Government Inflation-Protected Bonds (NYSE:WIP) yields 1.64% at the moment—modestly higher relative to our previous report.
Overall, the funds in the table above are yielding an average 2.44%, down from 3.02% as of Dec. 23. That’s still above the 1.62% for the benchmark 10-year Treasury Note. Nonetheless, the average ETF portfolio premium (based on the tickers above) over the 10-year yield has narrowed substantially since late-December, falling from 209 basis points to the current 82 basis points.
Keep in mind that while some trailing yields can look attractive, if only in relative terms, there are caveats to consider when using a rear-view mirror for evaluating payouts for risk assets. The main issue is that payouts over the past year aren’t set in stone. In short, there’s no guarantee that a given trailing yield will prevail.
A clear example of yield risk is visible in recent changes for Vanguard Global ex-U.S. Real Estate (VNQI). When we published this update last Dec. 23, VNQI was the top-yielding asset with a stellar 6.87% trailing payout rate. It looked too good to be true, and it was. The fund’s distributions have collapsed recently and the current trailing yield is now a shadow of its former self: a mere 0.92%.
Let’s also be mindful of the fact that even if today’s yield prevails, you may still lose money with risk assets. Capital losses can easily wipe any payout (and then some).
Fortunately, there’s more stability in a broadly diversified portfolio of risk assets in the desperate search for yield, although the same risks apply, albeit in a lesser degree.
If you absolutely need high reliability in matters of yield, highly rated government bonds are the only game in town. Then again, that’s no free lunch either at a time when interest rates are rising.
All of which leads us back to square one and the standard decision: pick your poison(s) carefully and manage expectations aggressively.
