After rallying almost $100 an ounce from the July lows of about $1210 (basis December futures), gold is consolidating its gains.
Fundamentally, there's little driving either side of gold's fear or love trade. That’s the root cause of this sideways price action and it's healthy.
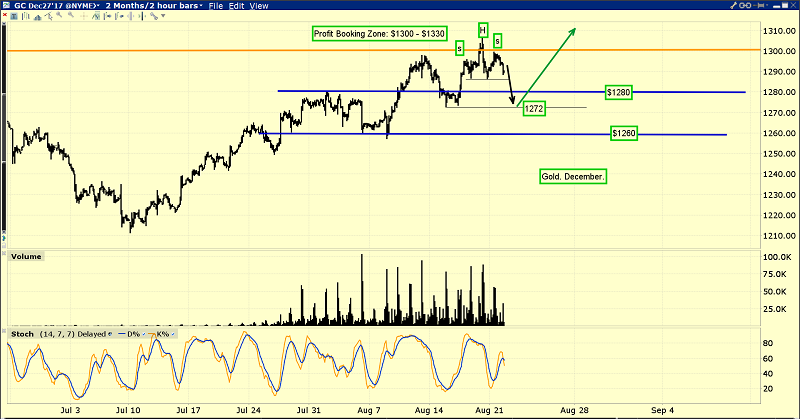
Some technical perspective on the consolidation for this short-term gold chart.
A small head-and-shoulders top pattern has appeared and it suggests more consolidation will occur before the upside action resumes. This scenario would see gold move down toward $1272, and then rally toward $1330.
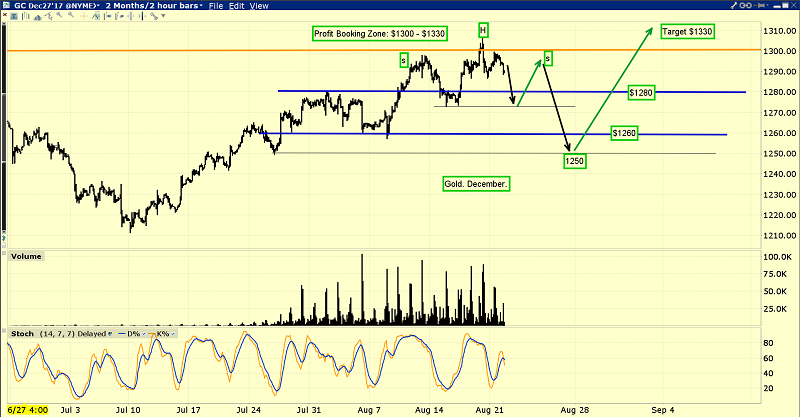
On this chart, a slightly bigger head-and-shoulders pattern is apparent. It suggests that a deeper correction to about $1250 may occur.
I’ve outlined the $1300-$1330 price zone as a good place to book some light profits on positions bought into my $1220-$1200 buy zone. From here, investors should be viewing the $1275-$1245 price zone as a fresh buy zone.
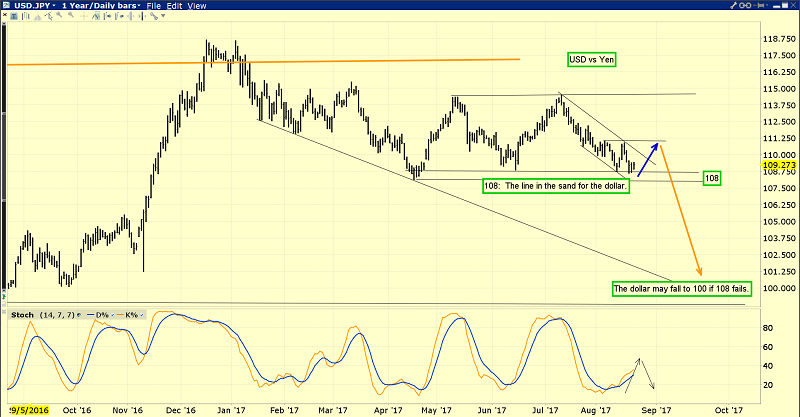
This is the important dollar versus yen chart.
The world’s biggest liquidity movers are major bank forex departments and they tend to aggressively buy the dollar versus the yen when global risk is declining.
When global risk rises, they will aggressively sell the dollar against the yen.
Both gold and the yen are viewed by these liquidity flow monsters as the world’s most important safe havens. The 108 dollar-versus-yen price is a very similar “line in the sand” to the $1300 line in the sand for gold.
The dollar is consolidating its recent decline in the 108 area as gold consolidates in the $1300 zone. Fundamentals make charts, and earth shaking news in September and October could see the dollar tumble under 108 and gold blast through $1300.
The debt-ceiling (which I call a floor) debate is one event that could create a major panic in risk-on markets in this critical September-October time frame.
That fear trade rubber is going to meet the road just as Indian dealers begin buying gold aggressively for Diwali. They appear to be in pause mode now, which is logical since they don’t tend to chase the price after it has rallied almost $100 an ounce.
As I’ve mentioned, all gold bugs need to be focused on the $1275-$1245 buy zone. Perhaps even more importantly, the gold bugs need to be ready to press the buy button for their favorite gold stocks if gold moves into that key buy zone.
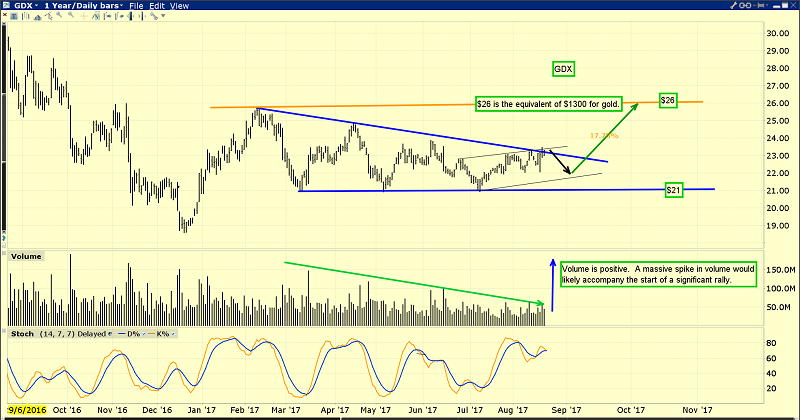
This is the VanEck Vectors Gold Miners (NYSE:GDX) chart. The $26 area for GDX corresponds with $1300 for gold. Gold has traded at the $1300 area numerous times since February, but GDX rallies have not taken it to $26.
I understand that most gold bugs are heavily invested in gold stocks. The inability of these stocks to consistently outperform bullion is frustrating, but there is light in that tunnel.
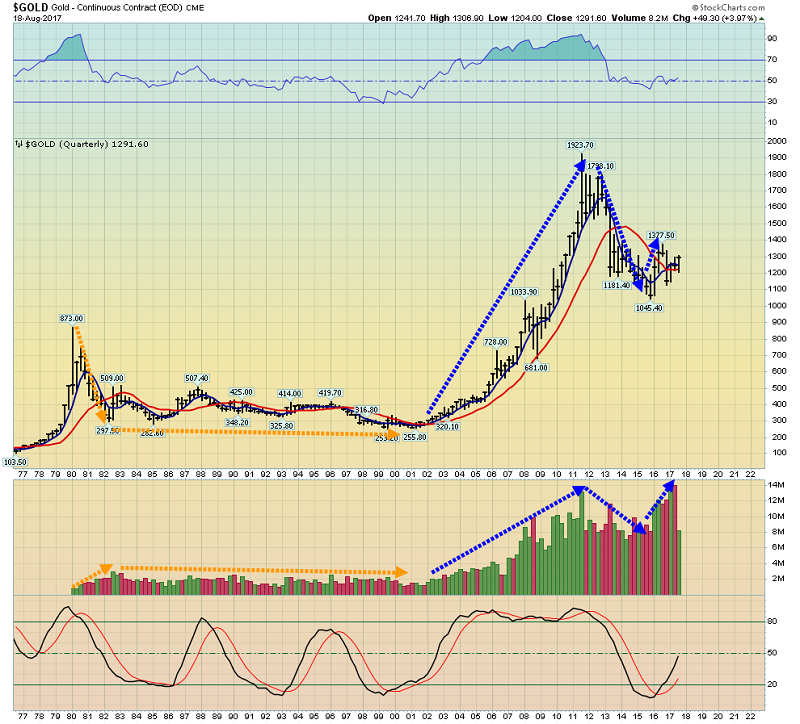
We're beginning to see the light with this this long-term gold chart. Bull markets have rising volume and bear markets have rising volume. Corrective action, up or down, is accompanied by falling volume.
Gold has been in a bull cycle since 2002. Volume has risen on major price advances and dwindled on declines.
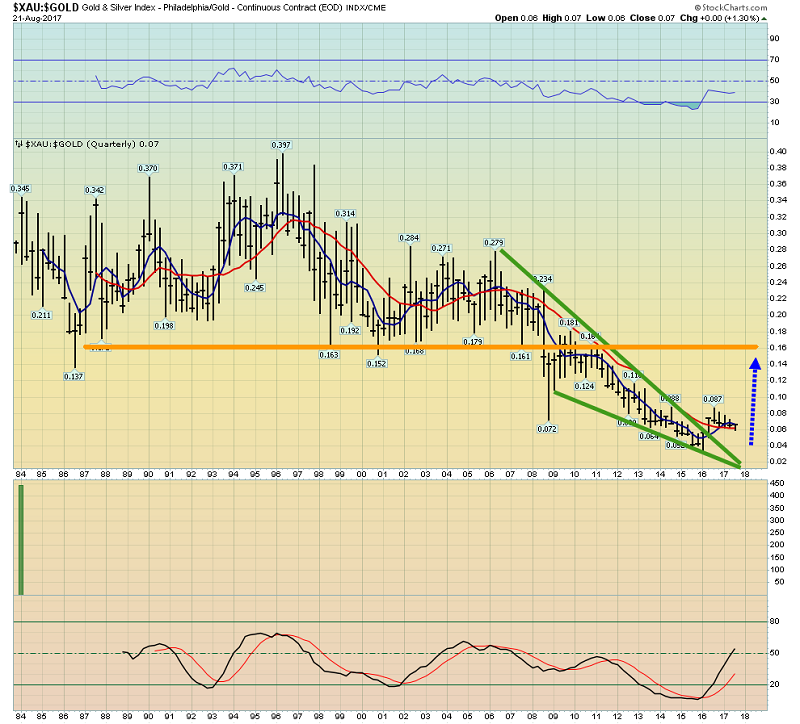
Gold stocks were in a bear cycle against gold from 1995–2016.
That happened because the Fed lowered rates to make small inexperienced investors move their money out of bank accounts and into risky investments focused on capital gain.
The 1995-2016 bear market in gold stocks against gold is over. Just as gold based against the dollar in the 1999-2001 period before blasting higher on big volume, gold stocks are doing the same thing against gold now.
Quantitative tightening in America, Japan and Europe is coming. Higher rates are in play. This is going to (slowly at first) move money out of global stock markets and government bonds and into the fractional reserve banking system. That will reverse the money velocity bear cycle that corresponded with the gold-stock bear market.
It’s a steady process, but it requires investors to be realistic about the time required to create a money velocity bull market… and thus a gold stocks bull market against gold.
Bottom Line
Good gold stock times are not quite here, but they are near!
Stewart Thomson is a retired Merrill Lynch broker. Stewart writes the Graceland Updates daily between 4am-7am. They are sent out around 8am-9am. The newsletter is attractively priced and the format is a unique numbered point form. Giving clarity of each point and saving valuable reading time.
Risks, Disclaimers, Legal
Stewart Thomson is no longer an investment advisor. The information provided by Stewart and Graceland Updates is for general information purposes only. Before taking any action on any investment, it is imperative that you consult with multiple properly licensed, experienced and qualified investment advisors and get numerous opinions before taking any action. Your minimum risk on any investment in the world is: 100% loss of all your money. You may be taking or preparing to take leveraged positions in investments and not know it, exposing yourself to unlimited risks. This is highly concerning if you are an investor in any derivatives products. There is an approx $700 trillion OTC Derivatives Iceberg with a tiny portion written off officially. The bottom line:
Are You Prepared?
