It is always nice to see the situation when fundamentals work together with the technical analysis. Event from yesterday evening helped to bring the risk-on mode to the market, so a situation, where traders are focusing on riskier assets, in the same time avoiding the save heavens. This kind of sentiment was just a continuation of that one seen recently, so created a nice opportunity for trend followers.
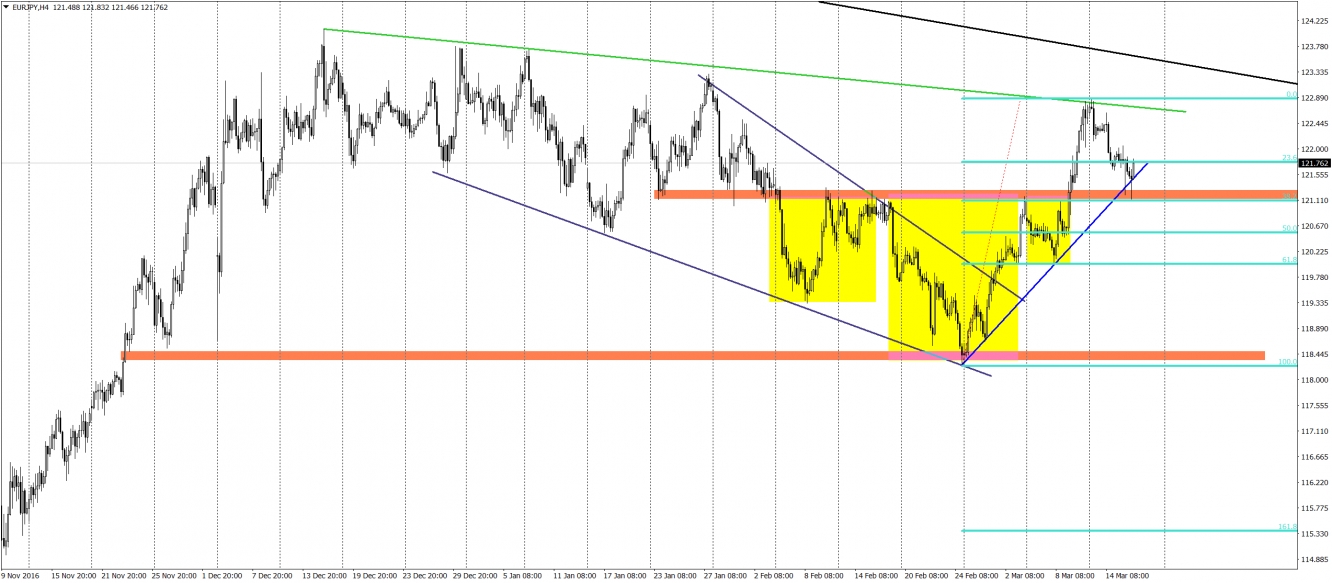
The best setup for us at the moment is present on the EUR/JPY chart, where the price was going up after creating an iH&S pattern (yellow). As it usually happens, after the breakout of the neckline, we do have an upswing and later on a bearish correction aiming usually the neckline from the top and testing it as a support. That test was done twice and in every case caused an upswing. The second one is especially promising as is created with a hammer candlestick and is happening on both: mid-term up trendline and 38,2% Fibonacci. As you can see, we are having a bullish combo here and a potentially a very good buying opportunity. Neckline, Fibonacci and trendline seems defended in the mid-term so probability for an upswing is quite high.
Bullish sentiment stays positive as long as we stay above the neck line and 38,2% Fibonacci. Breakout of this support is currently rather unlikely.

